Magnolia Oil & Gas Corporation (MGY): Price and Financial Metrics
GET POWR RATINGS... FREE!
MGY POWR Grades
- MGY scores best on the Quality dimension, with a Quality rank ahead of 98.48% of US stocks.
- The strongest trend for MGY is in Momentum, which has been heading down over the past 179 days.
- MGY's current lowest rank is in the Sentiment metric (where it is better than 14.21% of US stocks).
MGY Stock Summary
- Of note is the ratio of MAGNOLIA OIL & GAS CORP's sales and general administrative expense to its total operating expenses; just 6.59% of US stocks have a lower such ratio.
- Over the past twelve months, MGY has reported earnings growth of 173.77%, putting it ahead of 91.17% of US stocks in our set.
- As for revenue growth, note that MGY's revenue has grown 88.72% over the past 12 months; that beats the revenue growth of 90.57% of US companies in our set.
- If you're looking for stocks that are quantitatively similar to MAGNOLIA OIL & GAS CORP, a group of peers worth examining would be GSAT, MTDR, USAS, EGY, and ARLP.
- MGY's SEC filings can be seen here. And to visit MAGNOLIA OIL & GAS CORP's official web site, go to www.magnoliaoilgas.com.
MGY Valuation Summary
- MGY's price/sales ratio is 3.1; this is 129.63% higher than that of the median Energy stock.
- MGY's price/earnings ratio has moved NA NA over the prior 67 months.
Below are key valuation metrics over time for MGY.
Stock | Date | P/S | P/B | P/E | EV/EBIT |
---|---|---|---|---|---|
MGY | 2023-01-13 | 3.1 | 4.0 | 6.3 | 5.3 |
MGY | 2023-01-12 | 3.1 | 4.0 | 6.3 | 5.3 |
MGY | 2023-01-11 | 2.9 | 3.9 | 6.1 | 5.1 |
MGY | 2023-01-10 | 2.9 | 3.8 | 6.0 | 5.0 |
MGY | 2023-01-09 | 2.9 | 3.8 | 6.0 | 5.1 |
MGY | 2023-01-06 | 2.9 | 3.8 | 5.9 | 5.0 |
MGY's Quality Factors
The “Quality” component of the POWR Ratings focuses on 31 different factors of a companies fundamentals and operational strength. Here are some key insights as we drill into the specifics of these quality attributes.- MGY has a Quality Grade of A, ranking ahead of 96.31% of graded US stocks.
- MGY's asset turnover comes in at 0.595 -- ranking 38th of 136 Petroleum and Natural Gas stocks.
- 500 - Internal server error
The table below shows MGY's key quality metrics over time.
Period | Asset Turnover | Gross Margin | ROIC |
---|---|---|---|
2021-09-30 | 0.595 | 0.867 | 0.217 |
2021-06-30 | 0.499 | 0.849 | 0.142 |
2021-03-31 | 0.390 | 0.815 | 0.070 |
2020-12-31 | 0.369 | 0.798 | -0.819 |
2020-09-30 | 0.315 | 0.815 | -0.630 |
2020-06-30 | 0.298 | 0.834 | -0.503 |
MGY Price Target
For more insight on analysts targets of MGY, see our MGY price target page. And for a list of of all stocks sorted by upside potential based on analyst target price, see our Top Price Target page.
Average Price Target | $17.38 | Average Broker Recommendation | 1.6 (Moderate Buy) |
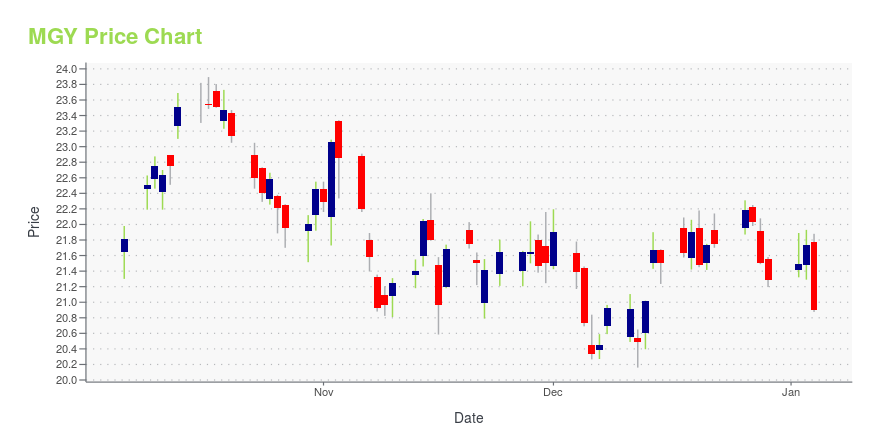
MGY Stock Price Chart Interactive Chart >
MGY Price/Volume Stats
Current price | $23.61 | 52-week high | $30.31 |
Prev. close | $22.94 | 52-week low | $18.01 |
Day low | $22.71 | Volume | 2,038,800 |
Day high | $23.63 | Avg. volume | 1,792,370 |
50-day MA | $23.75 | Dividend yield | 1.69% |
200-day MA | $23.72 | Market Cap | 5.10B |
Magnolia Oil & Gas Corporation (MGY) Company Bio
Magnolia Oil & Gas Corporation operates as an oil and gas exploration and production company. It has operations in South Texas in the core of the Eagle Ford. The company is based in Houston, Texas.
Latest MGY News From Around the Web
Below are the latest news stories about MAGNOLIA OIL & GAS CORP that investors may wish to consider to help them evaluate MGY as an investment opportunity.
Magnolia Oil & Gas Schedules Conference Call for Fourth Quarter and Full Year 2022 ResultsMagnolia Oil & Gas Corporation (NYSE: MGY) will host a conference call and webcast to discuss operational and financial results for the fourth quarter and full year 2022 on Wednesday, February 15 at 10:00 a.m. Central Time (11:00 a.m. Eastern Time). Join the webcast by visiting Magnolia’s website at www.magnoliaoilgas.com/investors/events-and-presentations and clicking on the webcast link or |
Do you want to know where to find good stock? Take a look at Magnolia Oil & Gas Corporation’s (NYSE:MGY) Sentiment AnalysisCurrently, Magnolia Oil & Gas Corporation’s (MGY) stock is trading at $21.65, marking a fall of -3.26% from last night’s close. At this price, the stock is -28.57% below its 52-week high of $30.31 and 20.21% above its 52-week low of $18.01. Based on the past 30-day period, the stock price is -10.77% below the […] |
Magnolia Oil & Gas cuts Q4 production guidance; maintains 2023 outlook (NYSE:MGY)Magnolia Oil & Gas (MGY) -1.8% post-market Wednesday after saying it expects to report Q4 oil and gas production volume of 73K-74K boe/day, compared to the 78K midpoint of prior guidance. |
Magnolia Oil & Gas Announces Preliminary Fourth Quarter 2022 ProductionMagnolia Oil & Gas Corporation (NYSE: MGY) announced preliminary fourth quarter 2022 estimated oil and gas production volumes in the range of 73 to 74 Mboe per day, compared to the midpoint of the Company’s earlier guidance of 78 Mboe per day. Two factors led to the production variance compared to previous guidance. First, a single large pad was brought online later than expected during the |
Magnolia Oil & Gas: A Top-Pick Oil Stock To Invest In For 2023 (NYSE:MGY)What stock should you invest in for 2023, if you are bullish oil but are concerned about the potential for stock market volatility due to a recession? In this article, I will evaluate… |
MGY Price Returns
1-mo | N/A |
3-mo | -6.64% |
6-mo | 7.39% |
1-year | 6.36% |
3-year | 129.77% |
5-year | 147.91% |
YTD | 0.68% |
2022 | 26.52% |
2021 | 168.77% |
2020 | -43.88% |
2019 | 12.22% |
2018 | 15.09% |
MGY Dividends
Ex-Dividend Date | Type | Payout Amount | Change | ||||||
---|---|---|---|---|---|---|---|---|---|
Loading, please wait... |
Loading social stream, please wait...