M/I Homes, Inc. (MHO): Price and Financial Metrics


M/I Homes, Inc. (MHO): $61.10

0.11 (+0.18%)

POWR Rating

Component Grades

Growth

S

Value

I

Momentum

G

Stability

N

Sentiment

U

Quality

P

Add MHO to Watchlist
Sign Up

Industry: Homebuilders


Ranked

of

in industry

MHO POWR Grades

  • Momentum is the dimension where MHO ranks best; there it ranks ahead of 99.04% of US stocks.
  • The strongest trend for MHO is in Quality, which has been heading up over the past 177 days.
  • MHO's current lowest rank is in the Stability metric (where it is better than 33.01% of US stocks).

MHO Stock Summary

  • MHO's current price/earnings ratio is 3.42, which is higher than just 6.32% of US stocks with positive earnings.
  • Of note is the ratio of M/I HOMES INC's sales and general administrative expense to its total operating expenses; 80.4% of US stocks have a lower such ratio.
  • MHO's price/sales ratio is 0.41; that's higher than the P/S ratio of just 14.51% of US stocks.
  • Stocks with similar financial metrics, market capitalization, and price volatility to M/I HOMES INC are ARC, GRBK, STC, CCS, and PGTI.
  • MHO's SEC filings can be seen here. And to visit M/I HOMES INC's official web site, go to www.mihomes.com.

MHO Valuation Summary

  • In comparison to the median Consumer Cyclical stock, MHO's EV/EBIT ratio is 71.54% lower, now standing at 3.7.
  • MHO's price/earnings ratio has moved down 4.9 over the prior 243 months.

Below are key valuation metrics over time for MHO.

Stock Date P/S P/B P/E EV/EBIT
MHO 2023-03-22 0.4 0.8 3.4 3.7
MHO 2023-03-21 0.4 0.8 3.4 3.7
MHO 2023-03-20 0.4 0.8 3.4 3.7
MHO 2023-03-17 0.4 0.8 3.3 3.6
MHO 2023-03-16 0.4 0.8 3.3 3.6
MHO 2023-03-15 0.4 0.8 3.2 3.6

MHO Growth Metrics

    Its year over year net income to common stockholders growth rate is now at 37.83%.
  • Its 2 year net income to common stockholders growth rate is now at 185.18%.
  • Its 2 year revenue growth rate is now at 45.48%.
Over the past 34 months, MHO's revenue has gone up $1,534,609,000.

The table below shows MHO's growth in key financial areas (numbers in millions of US dollars).

Date Revenue Operating Cash Flow Net Income to Common Stock
2022-12-31 4,131.393 184.071 490.662
2022-09-30 3,966.145 3.369 473.65
2022-06-30 3,857.536 -112.084 433.072
2022-03-31 3,777.922 -22.665 403.841
2021-12-31 3,745.887 -16.823 396.868
2021-09-30 3,600.562 -63.233 363.568

MHO's Quality Factors

The “Quality” component of the POWR Ratings focuses on 31 different factors of a companies fundamentals and operational strength. Here are some key insights as we drill into the specifics of these quality attributes.
  • MHO has a Quality Grade of C, ranking ahead of 28.03% of graded US stocks.
  • MHO's asset turnover comes in at 1.279 -- ranking 23rd of 51 Construction stocks.
  • NVR, FIX, and MTH are the stocks whose asset turnover ratios are most correlated with MHO.

The table below shows MHO's key quality metrics over time.

Period Asset Turnover Gross Margin ROIC
2021-09-30 1.279 0.245 0.138
2021-06-30 1.333 0.241 0.140
2021-03-31 1.306 0.234 0.122
2020-12-31 1.271 0.225 0.103
2020-09-30 1.273 0.214 0.091
2020-06-30 1.220 0.207 0.078

MHO Price Target

For more insight on analysts targets of MHO, see our MHO price target page. And for a list of of all stocks sorted by upside potential based on analyst target price, see our Top Price Target page.

Average Price Target $88.00 Average Broker Recommendation 1.5 (Moderate Buy)

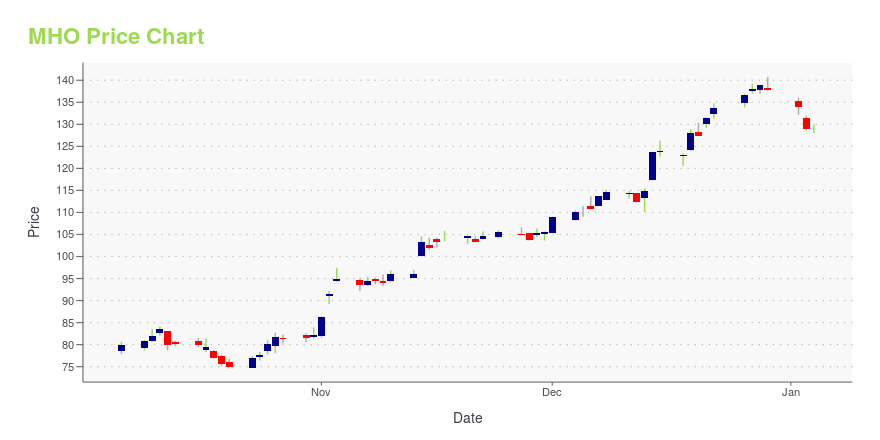
MHO Stock Price Chart Interactive Chart >

Price chart for MHO

MHO Price/Volume Stats

Current price $61.10 52-week high $64.68
Prev. close $60.99 52-week low $34.33
Day low $60.85 Volume 26,722
Day high $61.47 Avg. volume 303,602
50-day MA $58.83 Dividend yield N/A
200-day MA $47.19 Market Cap 1.69B

M/I Homes, Inc. (MHO) Company Bio


M/I Homes Inc. operates as a builder of single-family homes in Ohio, Indiana, Illinois, Maryland, Virginia, North Carolina, Florida, and Texas, the United States. The company was founded in 1973 and is based in Columbus, Ohio.


MHO Latest News Stream


Event/Time News Detail
Loading, please wait...

MHO Latest Social Stream


Loading social stream, please wait...

View Full MHO Social Stream

Latest MHO News From Around the Web

Below are the latest news stories about M/I HOMES INC that investors may wish to consider to help them evaluate MHO as an investment opportunity.

M/I Homes Full Year 2022 Earnings: Beats Expectations

M/I Homes ( NYSE:MHO ) Full Year 2022 Results Key Financial Results Revenue: US$4.13b (up 10% from FY 2021). Net...

Yahoo | February 19, 2023

What Makes M/I Homes (MHO) an Attractive Long-Term Investment Opportunity?

Miller Value Partners, an investment management company, released its “Deep Value Strategy” fourth-quarter 2022 investor letter. A copy of the same can be downloaded here. In the fourth quarter, the Deep Value Strategy was up 34%, compared to a 13.49% gain for the S&P 1500 Value Index. Investment in Value and cyclical stocks favored the strategy […]

Yahoo | February 6, 2023

M/I Homes, Inc. (NYSE:MHO) Q4 2022 Earnings Call Transcript

M/I Homes, Inc. (NYSE:MHO) Q4 2022 Earnings Call Transcript February 1, 2023 Operator: Good afternoon, ladies and gentlemen. Thank you for joining today’s M/I Homes’ Fourth Quarter and Year Ending Earnings Conference Call. My name is Tia, and I will be your moderator for today’s call. All lines will be muted during the presentation portion […]

Yahoo | February 2, 2023

Are Strong Financial Prospects The Force That Is Driving The Momentum In M/I Homes, Inc.'s NYSE:MHO) Stock?

M/I Homes (NYSE:MHO) has had a great run on the share market with its stock up by a significant 53% over the last three...

Yahoo | February 2, 2023

M/I Homes (MHO) Tops Q4 Earnings and Revenue Estimates

M/I Homes (MHO) delivered earnings and revenue surprises of 23.80% and 18.66%, respectively, for the quarter ended December 2022. Do the numbers hold clues to what lies ahead for the stock?

Yahoo | February 1, 2023

Read More 'MHO' Stories Here

MHO Price Returns

1-mo 5.64%
3-mo 32.31%
6-mo 68.64%
1-year 32.71%
3-year 259.41%
5-year 91.84%
YTD 32.31%
2022 -25.73%
2021 40.39%
2020 12.55%
2019 87.20%
2018 -38.90%

Get Free Updates

Join thousands of investors who get the latest news, insights and top rated picks from StockNews.com!


Page generated in 0.7718 seconds.