
Moving iMage Technologies, Inc. (MITQ): Price and Financial Metrics
MITQ Price/Volume Stats
| Current price | $0.66 | 52-week high | $1.44 |
| Prev. close | $0.67 | 52-week low | $0.42 |
| Day low | $0.63 | Volume | 57,404 |
| Day high | $0.71 | Avg. volume | 586,910 |
| 50-day MA | $0.61 | Dividend yield | N/A |
| 200-day MA | $0.70 | Market Cap | 6.77M |
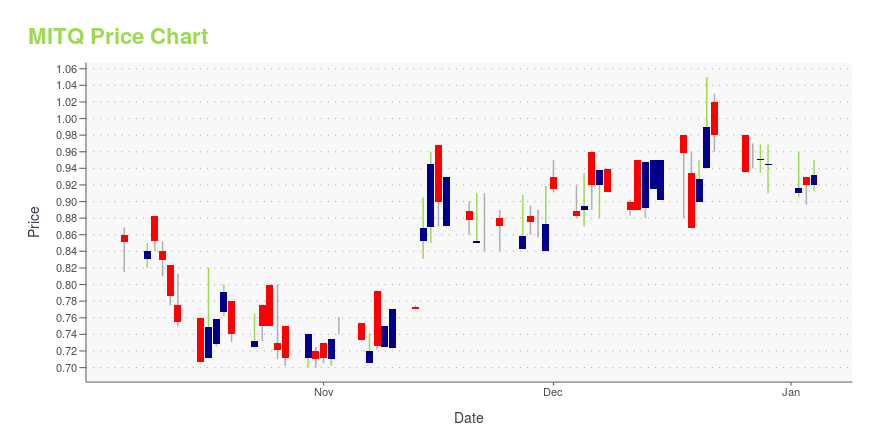
MITQ Stock Price Chart Interactive Chart >
Moving iMage Technologies, Inc. (MITQ) Company Bio
Moving iMage Technologies, Inc., a digital cinema company, designs, manufactures, integrates, installs, and distributes proprietary and custom designed equipment, and other off the shelf cinema products for cinema requirements in the United State, Mexico, and internationally. Its products and services focus on the integration needs associated with the building, modernization, and equipping of motion picture exhibition theatres. The company provides automation systems for digital cinema applications; proprietary rack mount pedestals; in-house designed and assembled suite of products to support boothless theatre designs and alternative auditorium configurations; and in-house designed and assembled lighting products and dimmers, as well as distributes digital cinema projectors and servers. It also offers premium sound systems and enclosures; DCE-10/20 demand controlled ventilation systems that automatically shuts down projector exhaust fans; and reclining seats and armrests, concession tables and trays, tablet arms, cup holders, and step and aisle lighting products for theaters and other public venues. In addition, the company provides enterprise and operations software solutions, such as CineQC, a cinema presence management and remote control system; and Cinergy, which allows an exhibitor to store, monitor, and manage digital cinema log files in a secure and centralized location. Further, it offers custom engineering, systems design, integration and installation, and digital technology services, as well as software solutions for 3D, digital cinema, and audio visual integration; project management and systems design services for theatre upgrades and new theatre builds; furniture, fixture, and equipment services to commercial cinema exhibitors for new construction and remodels; and network operations center, and cinema equipment installations and after-sale maintenance services. The company was founded in 2003 and is headquartered in Fountain Valley, California.
Latest MITQ News From Around the Web
Below are the latest news stories about MOVING IMAGE TECHNOLOGIES INC that investors may wish to consider to help them evaluate MITQ as an investment opportunity.
Moving iMage Technologies, Inc. (AMEX:MITQ) Q1 2024 Earnings Call TranscriptMoving iMage Technologies, Inc. (AMEX:MITQ) Q1 2024 Earnings Call Transcript November 14, 2023 Operator: Greetings, and welcome to the Moving iMage Technologies First Quarter 2024 Earnings Conference Call. At this time, all participants are in a listen-only mode. A brief question and answer session will follow the formal presentation. [Operator Instructions] As a reminder, this […] |
Sidoti Events, LLC’s Virtual November Micro-Cap ConferenceNEW YORK, NY / ACCESSWIRE / November 14, 2023 / Sidoti Events, LLC, an affiliate of Sidoti & Company, LLC, has released the presentation schedule and weblinks for its two-day November Micro-Cap Conference taking place Wednesday and Thursday, November ... |
Moving iMage Technologies Announces First Quarter Fiscal 2024 ResultsFOUNTAIN VALLEY, Calif., November 14, 2023--Moving iMage Technologies, Inc. (NYSE AMERICAN: MITQ), ("MiT"), a leading technology and services company for cinema, Esports, stadiums, arenas and other out-of-home entertainment venues, today announced results for its first quarter ended September 30, 2023. |
CORRECTING and REPLACING Moving iMage Technologies to Report First Quarter 2024 Results on November 14, 2023FOUNTAIN VALLEY, Calif., November 09, 2023--The date in the headline, first and second paragraphs, and the Dial-in and Webcast Information section should be November 14 (instead of November 13) and the date in the Telephone Replay section should be November 28 (instead of November 27) for the release dated Nov. 6, 2023. |
Moving iMage Technologies to Present and Conduct 1:1 Meetings at The Sidoti Virtual MicroCap Conference on November 15 and 16thFOUNTAIN VALLEY, Calif., November 08, 2023--Moving iMage Technologies (NYSE American: MITQ) (MiT) announced today that it will be presenting at the Sidoti MicroCap Conference on November 15, at 3:15 p.m. E.T. Investors can request 1:1 meetings through the Sidoti Portal. |
MITQ Price Returns
| 1-mo | 8.20% |
| 3-mo | 29.39% |
| 6-mo | -24.27% |
| 1-year | -33.34% |
| 3-year | -83.66% |
| 5-year | N/A |
| YTD | -30.16% |
| 2023 | -17.83% |
| 2022 | -45.24% |
| 2021 | N/A |
| 2020 | N/A |
| 2019 | N/A |
Loading social stream, please wait...