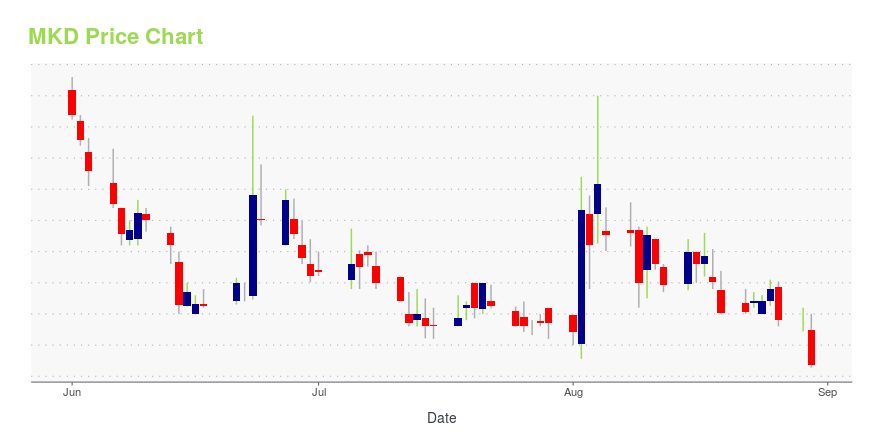
Molecular Data Inc. ADR (MKD): Price and Financial Metrics
MKD Price/Volume Stats
| Current price | $0.41 | 52-week high | $7.87 |
| Prev. close | $0.40 | 52-week low | $0.39 |
| Day low | $0.39 | Volume | 427,400 |
| Day high | $0.48 | Avg. volume | 698,406 |
| 50-day MA | $0.53 | Dividend yield | N/A |
| 200-day MA | $1.99 | Market Cap | 3.78M |
MKD Stock Price Chart Interactive Chart >
Molecular Data Inc. ADR (MKD) Company Bio
Molecular Data, Inc. operates a data-driven integrated platform in chemical e-commerce industry that provides database and business intelligence services, financing information services, and warehousing and logistics facilitation services. It operates through the following segments: Chemical Trading-Direct Sales Model, Chemical Trading-Marketplace Model, and Online Membership Service. The Chemical Trading-Direct Sales Model segment acquires chemicals from suppliers and sell directly to customers and generate revenue from the sales price of relevant chemicals. The Chemical Trading-Marketplace Model segment generates revenue from commission fees. The Online Membership Service segment refers to the revenue from the service fees charged to online members in relation to the membership services, including advertising services and market updates. The company was founded by Dong Liang Chang and Li Li in 2018 and is headquarter in Shanghai, China.
Latest MKD News From Around the Web
Below are the latest news stories about MOLECULAR DATA INC that investors may wish to consider to help them evaluate MKD as an investment opportunity.
Molecular Data Inc. Receives NASDAQ NotificationMolecular Data, Inc. ("Molecular Data" or the "Company") (NASDAQ: MKD), a technology-driven platform in China, announced that it had received a letter from The Nasdaq Stock Market LLC ("Nasdaq"), notifying the Company that to date, it has not regained compliance with the Rule 5250(c)(1). |
Molecular Data Inc. Receives NASDAQ Notification Regarding Minimum Bid RequirementsMolecular Data, Inc. ("Molecular Data" or the "Company") (NASDAQ: MKD), a technology-driven platform in China, announced today that on May 25, 2021, it had received a letter from The Nasdaq Stock Market LLC ("Nasdaq"), notifying the Company that its minimum closing bid price per share for its ordinary shares had fallen below $1.00 for a period of 30 consecutive business days and that the Company did not meet the minimum bid price requirement set forth in Nasdaq Listing Rule 5550(a)(2). On Novemb |
Today’s Biggest Pre-Market Stock Movers: 10 Top Gainers and Losers on WednesdayRise and shine, traders! |
Molecular Data Inc. Announces ADS Ratio ChangeMolecular Data Inc. (NASDAQ: MKD) (the "Company") announced today a ratio change on its American Depositary Shares ("ADS") from the current one (1) ADS representing three (3) Class A ordinary shares to the new ratio of one (1) ADS representing forty-five (45) Class A ordinary shares (the "Ratio Change"). The effective date of the Ratio Change is expected to be May 23, 2022. |
Molecular Data Inc. Announces Receipt of Nasdaq Non-Compliance LetterMolecular Data Inc. (NASDAQ: MKD) (the "Company") announced today that on May 17, 2022, it received a Delinquency Compliance Plan Alert Letter (the "Letter") from The Nasdaq Stock Market LLC ("Nasdaq") stating that the Company was not in compliance with Nasdaq Listing Rule 5250(c)(1), because it has not timely filed its annual report on Form 20-F for the period ended December 31, 2021. |
MKD Price Returns
| 1-mo | N/A |
| 3-mo | N/A |
| 6-mo | N/A |
| 1-year | N/A |
| 3-year | -95.21% |
| 5-year | N/A |
| YTD | N/A |
| 2023 | N/A |
| 2022 | 0.00% |
| 2021 | -74.05% |
| 2020 | -82.43% |
| 2019 | N/A |


Loading social stream, please wait...