
MKS Instruments, Inc. (MKSI): Price and Financial Metrics
MKSI Price/Volume Stats
| Current price | $124.57 | 52-week high | $147.40 |
| Prev. close | $119.73 | 52-week low | $63.44 |
| Day low | $122.90 | Volume | 838,500 |
| Day high | $126.55 | Avg. volume | 783,015 |
| 50-day MA | $131.63 | Dividend yield | 0.67% |
| 200-day MA | $110.92 | Market Cap | 8.35B |
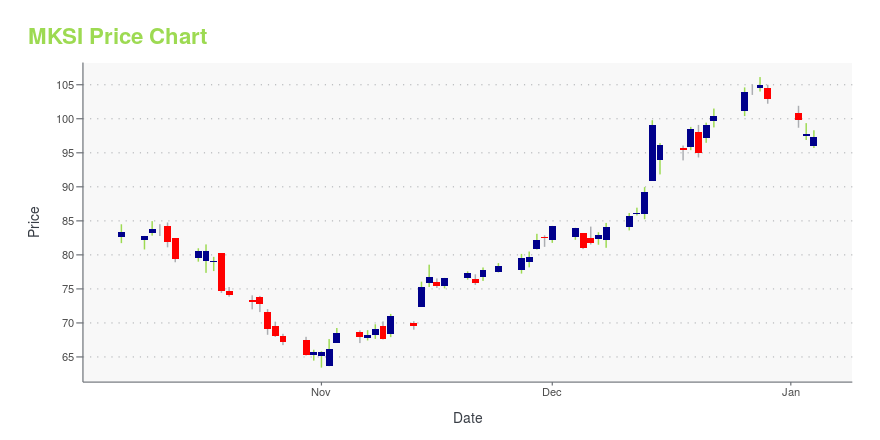
MKSI Stock Price Chart Interactive Chart >
MKS Instruments, Inc. (MKSI) Company Bio
MKS Instruments provides instruments, subsystems, and process control solutions that measure, control, power, monitor, and analyze critical parameters of manufacturing processes in the United States and internationally. The company operates through four segments: Advanced Manufacturing Capital Equipment, Analytical Solutions Group, Europe Region Sales & Service, and Asia Region Sales & Service. The company was founded in 1961 and is based in Andover, Massachusetts.
Latest MKSI News From Around the Web
Below are the latest news stories about MKS INSTRUMENTS INC that investors may wish to consider to help them evaluate MKSI as an investment opportunity.
MKS Instruments Commits to Reduce Carbon EmissionsTargets 42% reduction of combined scope 1 and 2 carbon emissions by 2030ANDOVER, Mass., Dec. 20, 2023 (GLOBE NEWSWIRE) -- MKS Instruments, Inc. (NASDAQ: MKSI), a global provider of enabling technologies that transform our world, today announced that it has committed to reduce its combined Scope 1 and 2 emissions by 42% by 2030 from its 2022 baseline, according to criteria established by the Science Based Targets initiative (SBTi). MKS is also continuing to evaluate the Scope 3 emissions targets |
MKS Instruments Named One of America’s Most Responsible CompaniesANDOVER, Mass., Dec. 07, 2023 (GLOBE NEWSWIRE) -- MKS Instruments (Nasdaq: MKSI), a global provider of technologies that transform our world, was recognized today as one of America’s Most Responsible Companies for 2024, presented by Newsweek and Statista, Inc. “We are proud that our environmentally and socially responsible business practices are being recognized by Newsweek and Statista,” said John T.C. Lee, President and Chief Executive Officer. “As we strive to develop products that enable our |
Seth H. Bagshaw to Retire as Chief Financial Officer of MKS InstrumentsRetirement in April 2024 caps 18-year career in helping build MKSANDOVER, Mass., Dec. 04, 2023 (GLOBE NEWSWIRE) -- MKS Instruments, Inc. (NASDAQ: MKSI), a global provider of enabling technologies that transform our world, today announced that Seth H. Bagshaw, 64, will retire as Executive Vice President, Chief Financial Officer and Treasurer, effective April 1, 2024, following a distinguished 18-year career with the Company. Mr. Bagshaw will serve as a special advisor to the Company through May 1 |
Insiders Are Buying These 3 Tech StocksInsiders have a more extended holding period than most, a critical aspect that investors should be aware of. |
Why Is MKS Instruments (MKSI) Up 24.8% Since Last Earnings Report?MKS Instruments (MKSI) reported earnings 30 days ago. What's next for the stock? We take a look at earnings estimates for some clues. |
MKSI Price Returns
| 1-mo | -4.15% |
| 3-mo | 3.34% |
| 6-mo | 13.51% |
| 1-year | 20.13% |
| 3-year | -18.52% |
| 5-year | 47.75% |
| YTD | 21.52% |
| 2023 | 22.62% |
| 2022 | -50.97% |
| 2021 | 16.38% |
| 2020 | 37.70% |
| 2019 | 71.89% |
MKSI Dividends
| Ex-Dividend Date | Type | Payout Amount | Change | ||||||
|---|---|---|---|---|---|---|---|---|---|
| Loading, please wait... | |||||||||
Continue Researching MKSI
Here are a few links from around the web to help you further your research on Mks Instruments Inc's stock as an investment opportunity:Mks Instruments Inc (MKSI) Stock Price | Nasdaq
Mks Instruments Inc (MKSI) Stock Quote, History and News - Yahoo Finance
Mks Instruments Inc (MKSI) Stock Price and Basic Information | MarketWatch
Loading social stream, please wait...