
MarketAxess Holdings Inc. (MKTX): Price and Financial Metrics
MKTX Price/Volume Stats
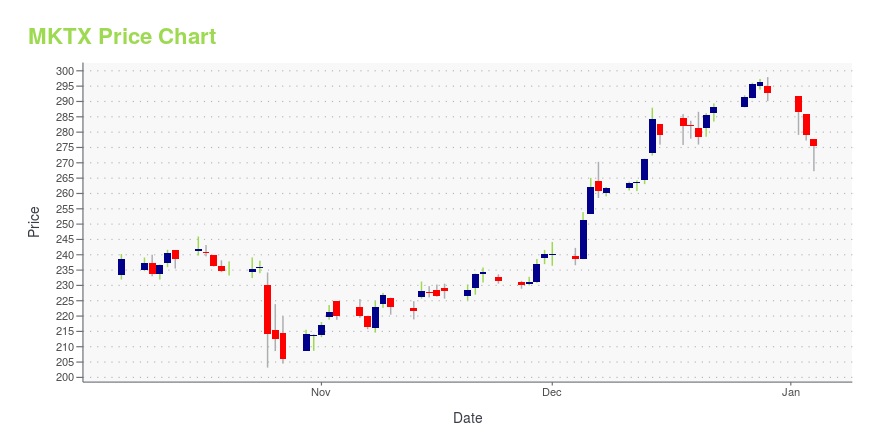
| Current price | $225.63 | 52-week high | $297.97 |
| Prev. close | $220.86 | 52-week low | $192.42 |
| Day low | $220.58 | Volume | 300,631 |
| Day high | $225.87 | Avg. volume | 424,651 |
| 50-day MA | $207.07 | Dividend yield | 1.34% |
| 200-day MA | $226.79 | Market Cap | 8.55B |
MKTX Stock Price Chart Interactive Chart >
MarketAxess Holdings Inc. (MKTX) Company Bio
MarketAxess Holdings Inc. (MarketAxess) is an international financial technology company that operates an electronic trading platform for the institutional credit markets, and also provides market data and post-trade services. It enables institutional investors and broker-dealers to trade credit instruments, including corporate bonds, and other types of fixed income products. (Source:Wikipedia)
Latest MKTX News From Around the Web
Below are the latest news stories about MARKETAXESS HOLDINGS INC that investors may wish to consider to help them evaluate MKTX as an investment opportunity.
MarketAxess Is Starting to Look 'Interesting'MarketAxess Holdings is a financial technology company that operates an electronic trading platform for the institutional credit markets. The On-Balance-Volume (OBV) line has improved the past six weeks. The weekly OBV line shows a long decline into lows in September/October. |
UPDATE 1-Tradeweb, MarketAxess and Bloomberg scrap joint bond data planTradeweb, MarketAxess and Bloomberg have scrapped joint plans to provide a single real-time feed of bond prices from across Europe to help investors spot the best deals, citing complexity and costs, leaving Wall Street ahead of the competition. The U.S. has long had so-called "consolidated tapes" which provide a feed of stock and bond prices transacted across markets, with the European Union and Britain wanting similar services to deepen their capital markets. The EU approved rules earlier this year for creating consolidated tapes of stock and bond prices from trading platforms to give investors a market-wide snapshot of activity. |
Tradeweb, MarketAxess and Bloomberg scrap joint bond prices 'tape' planTradeweb, MarketAxess and Bloomberg have scrapped plans to provide a prices tape for the bond market in Britain or the European Union, they said on Friday, citing "risk and complexity". The EU is seeking to deepen its capital market by creating "consolidated tapes" of stock and bond prices from trading platforms to give investors a market-wide snapshot to find the best deals. Britain is also looking at setting up similar tapes as Europe seeks to create a more efficient capital market that competes better with Wall Street, which has long had such price tapes. |
Taking a Closer Look at MarketAxess' (MKTX) 9.8% 2-Day RallyMarketAxess (MKTX) achieves record November trading volumes in Eurobonds, reaching $43.7 billion. |
Why MarketAxess Holdings Rocketed Higher Again TodayWhile it's early days, this seems to be an ideal week to own shares of bond trading platform operator MarketAxess Holdings (NASDAQ: MKTX). Well before the market open on Tuesday, Citigroup's Chris Allen raised his price target on MarketAxess stock. As the new target sits nearly 15% above the current market price, the prognosticator has maintained his buy recommendation. |
MKTX Price Returns
| 1-mo | 15.06% |
| 3-mo | 12.20% |
| 6-mo | -17.85% |
| 1-year | -15.21% |
| 3-year | -50.18% |
| 5-year | -32.45% |
| YTD | -22.44% |
| 2023 | 6.11% |
| 2022 | -31.50% |
| 2021 | -27.51% |
| 2020 | 51.28% |
| 2019 | 80.66% |
MKTX Dividends
| Ex-Dividend Date | Type | Payout Amount | Change | ||||||
|---|---|---|---|---|---|---|---|---|---|
| Loading, please wait... | |||||||||
Continue Researching MKTX
Want to see what other sources are saying about Marketaxess Holdings Inc's financials and stock price? Try the links below:Marketaxess Holdings Inc (MKTX) Stock Price | Nasdaq
Marketaxess Holdings Inc (MKTX) Stock Quote, History and News - Yahoo Finance
Marketaxess Holdings Inc (MKTX) Stock Price and Basic Information | MarketWatch
Loading social stream, please wait...