
MoneyLion Inc., (ML): Price and Financial Metrics
ML Price/Volume Stats
| Current price | $70.23 | 52-week high | $106.82 |
| Prev. close | $70.41 | 52-week low | $11.60 |
| Day low | $68.95 | Volume | 133,161 |
| Day high | $73.35 | Avg. volume | 198,516 |
| 50-day MA | $79.70 | Dividend yield | N/A |
| 200-day MA | $58.76 | Market Cap | 738.68M |
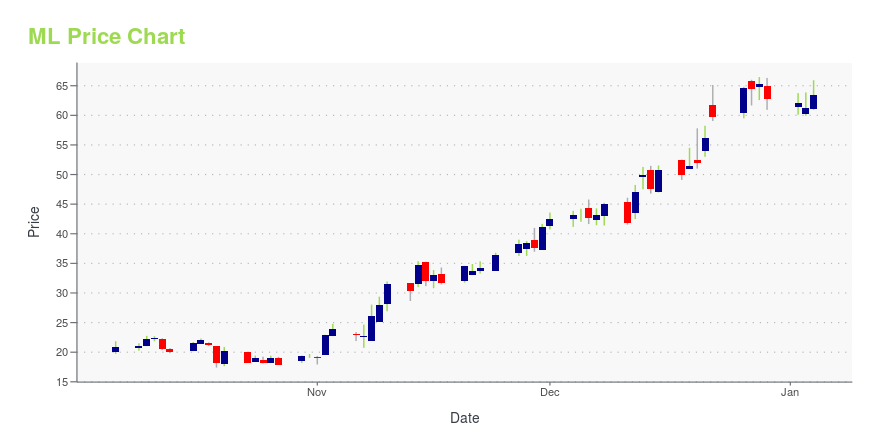
ML Stock Price Chart Interactive Chart >
MoneyLion Inc., (ML) Company Bio
MoneyLion Inc., a digital financial platform that provides access to banking, borrowing, and investing solutions for its customers. The company was founded in 2013 and is based in New York, New York with offices in Sioux Falls and Kuala Lumpur, Malaysia.
Latest ML News From Around the Web
Below are the latest news stories about MONEYLION INC that investors may wish to consider to help them evaluate ML as an investment opportunity.
MoneyLion to Participate in Needham’s 26th Annual Growth ConferenceNEW YORK, December 28, 2023--MoneyLion Inc. ("MoneyLion") (NYSE: ML), a leader in financial technology powering the next generation of personalized products and content, announced today its participation at the following financial conference in January: |
MicroMarvel: MoneyLionMoneyLion Inc. provides a digital financial platform. The company's platform offers access to banking, borrowing, and investing solutions for customers. |
3 Growth Stocks to Buy BEFORE the New Year’s Eve Ball DropNow is the time to scoop up promising growth stocks that have endured a punishing bear market but have promising futures. |
Here's Why Momentum in MoneyLion Inc. (ML) Should Keep goingMoneyLion Inc. (ML) could be a solid choice for shorter-term investors looking to capitalize on the recent price trend in fundamentally sound stocks. It is one of the many stocks that passed through our shorter-term trading strategy-based screen. |
Retail investors are MoneyLion Inc.'s (NYSE:ML) biggest owners and were rewarded after market cap rose by US$47m last weekKey Insights The considerable ownership by retail investors in MoneyLion indicates that they collectively have a... |
ML Price Returns
| 1-mo | 0.07% |
| 3-mo | -0.99% |
| 6-mo | 43.83% |
| 1-year | 476.13% |
| 3-year | -76.42% |
| 5-year | N/A |
| YTD | 12.03% |
| 2023 | 237.04% |
| 2022 | -84.62% |
| 2021 | -64.34% |
| 2020 | N/A |
| 2019 | N/A |
Loading social stream, please wait...