Martin Marietta Materials Inc. (MLM): Price and Financial Metrics
GET POWR RATINGS... FREE!
MLM POWR Grades
- MLM scores best on the Momentum dimension, with a Momentum rank ahead of 74.34% of US stocks.
- The strongest trend for MLM is in Quality, which has been heading down over the past 177 days.
- MLM's current lowest rank is in the Value metric (where it is better than 4.27% of US stocks).
MLM Stock Summary
- Of note is the ratio of MARTIN MARIETTA MATERIALS INC's sales and general administrative expense to its total operating expenses; 99.65% of US stocks have a lower such ratio.
- The ratio of debt to operating expenses for MARTIN MARIETTA MATERIALS INC is higher than it is for about 96.72% of US stocks.
- In terms of volatility of its share price, MLM is more volatile than just 7.63% of stocks we're observing.
- If you're looking for stocks that are quantitatively similar to MARTIN MARIETTA MATERIALS INC, a group of peers worth examining would be VIST, GRIN, CSV, MATX, and RYN.
- MLM's SEC filings can be seen here. And to visit MARTIN MARIETTA MATERIALS INC's official web site, go to www.martinmarietta.com.
MLM Valuation Summary
- In comparison to the median Basic Materials stock, MLM's price/sales ratio is 169.23% higher, now standing at 3.5.
- Over the past 243 months, MLM's price/sales ratio has gone up 2.7.
Below are key valuation metrics over time for MLM.
Stock | Date | P/S | P/B | P/E | EV/EBIT |
---|---|---|---|---|---|
MLM | 2023-01-24 | 3.5 | 3.1 | 25.6 | 22.2 |
MLM | 2023-01-23 | 3.5 | 3.1 | 25.8 | 22.3 |
MLM | 2023-01-20 | 3.5 | 3.1 | 25.7 | 22.2 |
MLM | 2023-01-19 | 3.4 | 3.1 | 25.4 | 22.0 |
MLM | 2023-01-18 | 3.5 | 3.1 | 26.0 | 22.4 |
MLM | 2023-01-17 | 3.5 | 3.2 | 26.1 | 22.5 |
MLM Growth Metrics
- Its 2 year net cashflow from operations growth rate is now at 16.84%.
- The 2 year cash and equivalents growth rate now stands at -55.28%.
- Its 4 year revenue growth rate is now at 22.83%.

The table below shows MLM's growth in key financial areas (numbers in millions of US dollars).
Date | Revenue | Operating Cash Flow | Net Income to Common Stock |
---|---|---|---|
2022-09-30 | 6,180.6 | 918.1 | 840 |
2022-06-30 | 5,926.2 | 982.7 | 799.3 |
2022-03-31 | 5,662.4 | 1,115.7 | 658.6 |
2021-12-31 | 5,414 | 1,137.7 | 702.5 |
2021-09-30 | 5,097.2 | 1,146.4 | 728.7 |
2021-06-30 | 4,861.3 | 1,118.1 | 768.5 |
MLM's Quality Factors
The “Quality” component of the POWR Ratings focuses on 31 different factors of a companies fundamentals and operational strength. Here are some key insights as we drill into the specifics of these quality attributes.- MLM has a Quality Grade of C, ranking ahead of 66.98% of graded US stocks.
- MLM's asset turnover comes in at 0.441 -- ranking 15th of 42 Non-Metallic and Industrial Metal Mining stocks.
- USAU, OPNT, and CMP are the stocks whose asset turnover ratios are most correlated with MLM.
The table below shows MLM's key quality metrics over time.
Period | Asset Turnover | Gross Margin | ROIC |
---|---|---|---|
2021-09-30 | 0.441 | 0.260 | 0.095 |
2021-06-30 | 0.453 | 0.265 | 0.106 |
2021-03-31 | 0.454 | 0.270 | 0.107 |
2020-12-31 | 0.453 | 0.265 | 0.102 |
2020-09-30 | 0.450 | 0.255 | 0.097 |
2020-06-30 | 0.462 | 0.253 | 0.091 |
MLM Price Target
For more insight on analysts targets of MLM, see our MLM price target page. And for a list of of all stocks sorted by upside potential based on analyst target price, see our Top Price Target page.
Average Price Target | $391.90 | Average Broker Recommendation | 1.63 (Moderate Buy) |
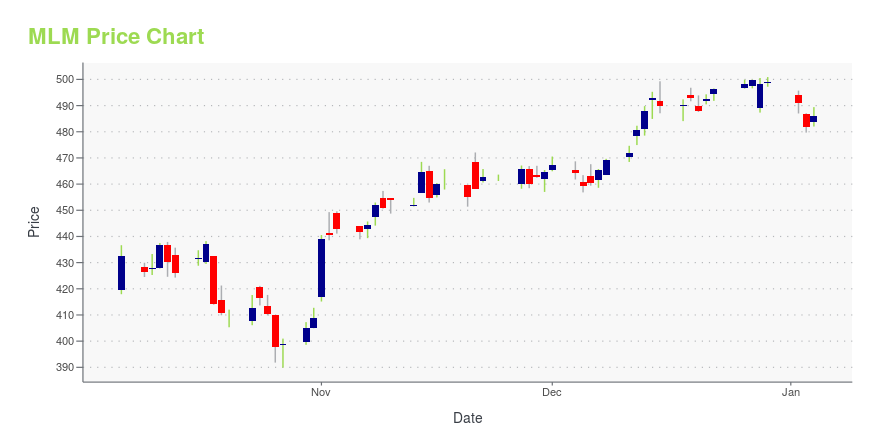
MLM Stock Price Chart Interactive Chart >
MLM Price/Volume Stats
Current price | $347.37 | 52-week high | $406.85 |
Prev. close | $347.82 | 52-week low | $284.99 |
Day low | $345.63 | Volume | 240,700 |
Day high | $350.14 | Avg. volume | 337,374 |
50-day MA | $351.24 | Dividend yield | 0.76% |
200-day MA | $339.57 | Market Cap | 21.57B |
Martin Marietta Materials Inc. (MLM) Company Bio
Martin Marietta Materials, Inc. is an American-based company and a member of the S&P 500 Index. The company is a supplier of aggregates and heavy building materials, with operations spanning 26 states, Canada and the Caribbean. In particular, Martin Marietta Materials supplies resources for the construction of roads, sidewalks and foundations. (Source:Wikipedia)
Latest MLM News From Around the Web
Below are the latest news stories about MARTIN MARIETTA MATERIALS INC that investors may wish to consider to help them evaluate MLM as an investment opportunity.
Martin Marietta Announces Fourth-Quarter and Full-Year 2022 Earnings Conference CallRALEIGH, N.C., Jan. 25, 2023 (GLOBE NEWSWIRE) -- Martin Marietta Materials, Inc. (NYSE:MLM) (“Martin Marietta” or the “Company”) will host its fourth-quarter and full-year 2022 earnings conference call on Wednesday, February 15, 2023 at 10:00 a.m. Eastern Time. The Company will release results for the quarter and year ended December 31, 2022, that morning before the market opens. |
Martin Marietta Stock Can Thrive in Both Inflation and DeflationMartin Marietta can weather both inflationary and deflationary environments, and despite the weakening economy, its outlook for growth is improving. |
The 7 Most Promising Industries to Invest in for a Profitable 2023With fears about a deep recession rapidly diminishing, stocks within these most promising industries should be off to the races soon. |
Calculating The Fair Value Of Martin Marietta Materials, Inc. (NYSE:MLM)In this article we are going to estimate the intrinsic value of Martin Marietta Materials, Inc. ( NYSE:MLM ) by... |
Is Martin Marietta Materials (MLM) a Good Stock To Buy?TimesSquare Capital Management, an equity investment management company, released its “U.S. Mid Cap Growth Strategy” third-quarter investor letter. A copy of the same can be downloaded here. In the third quarter, the strategy returned -0.21% (net), compared to -0.65% for the Russell Midcap Growth Index. Strength in Consumer Discretionary, Energy, Financials, Industrials, Information Technology, and Materials […] |
MLM Price Returns
1-mo | 2.78% |
3-mo | 7.78% |
6-mo | -3.14% |
1-year | -10.09% |
3-year | 34.80% |
5-year | 61.57% |
YTD | 2.78% |
2022 | -22.73% |
2021 | 56.11% |
2020 | 2.57% |
2019 | 64.18% |
2018 | -21.55% |
MLM Dividends
Ex-Dividend Date | Type | Payout Amount | Change | ||||||
---|---|---|---|---|---|---|---|---|---|
Loading, please wait... |
Continue Researching MLM
Want to see what other sources are saying about Martin Marietta Materials Inc's financials and stock price? Try the links below:Martin Marietta Materials Inc (MLM) Stock Price | Nasdaq
Martin Marietta Materials Inc (MLM) Stock Quote, History and News - Yahoo Finance
Martin Marietta Materials Inc (MLM) Stock Price and Basic Information | MarketWatch
Loading social stream, please wait...