Miller Industries, Inc. (MLR): Price and Financial Metrics
GET POWR RATINGS... FREE!
MLR Price/Volume Stats
Current price | $33.98 | 52-week high | $36.25 |
Prev. close | $34.11 | 52-week low | $21.00 |
Day low | $33.90 | Volume | 11,900 |
Day high | $34.58 | Avg. volume | 36,195 |
50-day MA | $34.20 | Dividend yield | 2.11% |
200-day MA | $28.11 | Market Cap | 388.77M |
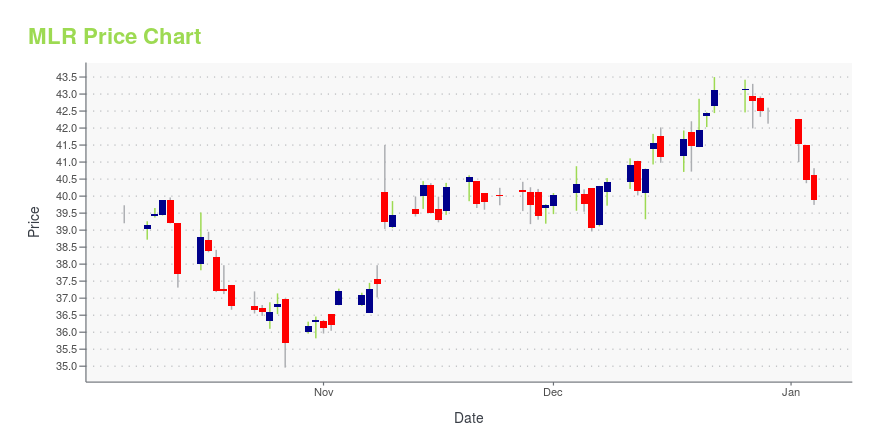
MLR Stock Price Chart Interactive Chart >
MLR POWR Grades
- Growth is the dimension where MLR ranks best; there it ranks ahead of 96.9% of US stocks.
- MLR's strongest trending metric is Growth; it's been moving up over the last 179 days.
- MLR's current lowest rank is in the Momentum metric (where it is better than 43.55% of US stocks).
MLR Stock Summary
- Price to trailing twelve month operating cash flow for MLR is currently 130.26, higher than 97.36% of US stocks with positive operating cash flow.
- Of note is the ratio of MILLER INDUSTRIES INC's sales and general administrative expense to its total operating expenses; 87.44% of US stocks have a lower such ratio.
- With a year-over-year growth in debt of 310.56%, MILLER INDUSTRIES INC's debt growth rate surpasses 95.39% of about US stocks.
- Stocks with similar financial metrics, market capitalization, and price volatility to MILLER INDUSTRIES INC are CHEF, XPEL, PVH, EDUC, and WDFC.
- MLR's SEC filings can be seen here. And to visit MILLER INDUSTRIES INC's official web site, go to www.millerind.com.
MLR Valuation Summary
- In comparison to the median Consumer Cyclical stock, MLR's price/sales ratio is 77.78% lower, now standing at 0.4.
- MLR's price/earnings ratio has moved up 15.7 over the prior 243 months.
Below are key valuation metrics over time for MLR.
Stock | Date | P/S | P/B | P/E | EV/EBIT |
---|---|---|---|---|---|
MLR | 2023-05-19 | 0.4 | 1.3 | 14.5 | 10.6 |
MLR | 2023-05-18 | 0.4 | 1.3 | 14.7 | 10.8 |
MLR | 2023-05-17 | 0.4 | 1.3 | 14.5 | 10.7 |
MLR | 2023-05-16 | 0.4 | 1.3 | 14.3 | 10.5 |
MLR | 2023-05-15 | 0.4 | 1.3 | 14.5 | 10.7 |
MLR | 2023-05-12 | 0.4 | 1.3 | 14.5 | 10.6 |
MLR Growth Metrics
- The 2 year price growth rate now stands at -4.29%.
- Its 4 year price growth rate is now at 10.54%.
- Its 3 year net cashflow from operations growth rate is now at -377.47%.

The table below shows MLR's growth in key financial areas (numbers in millions of US dollars).
Date | Revenue | Operating Cash Flow | Net Income to Common Stock |
---|---|---|---|
2022-09-30 | 824.293 | -23.37 | 13.769 |
2022-06-30 | 783.451 | -24.778 | 12.383 |
2022-03-31 | 763.109 | -16.515 | 15.142 |
2021-12-31 | 717.476 | 15.268 | 16.255 |
2021-09-30 | 694.122 | 23.616 | 25.56 |
2021-06-30 | 697.773 | 42.893 | 28.267 |
MLR's Quality Factors
The “Quality” component of the POWR Ratings focuses on 31 different factors of a companies fundamentals and operational strength. Here are some key insights as we drill into the specifics of these quality attributes.- MLR has a Quality Grade of C, ranking ahead of 61.21% of graded US stocks.
- MLR's asset turnover comes in at 1.67 -- ranking 10th of 68 Automobiles and Trucks stocks.
- ALSN, HY, and MTOR are the stocks whose asset turnover ratios are most correlated with MLR.
The table below shows MLR's key quality metrics over time.
Period | Asset Turnover | Gross Margin | ROIC |
---|---|---|---|
2021-09-30 | 1.670 | 0.113 | 0.149 |
2021-06-30 | 1.689 | 0.113 | 0.166 |
2021-03-31 | 1.624 | 0.117 | 0.162 |
2020-12-31 | 1.649 | 0.120 | 0.166 |
2020-09-30 | 1.719 | 0.120 | 0.165 |
2020-06-30 | 1.786 | 0.121 | 0.172 |
Miller Industries, Inc. (MLR) Company Bio
Miller Enterprises engages in the manufacture and sale of towing and recovery equipment. The company was founded in 1994 and is based in Ooltewah, Tennessee.
Latest MLR News From Around the Web
Below are the latest news stories about MILLER INDUSTRIES INC that investors may wish to consider to help them evaluate MLR as an investment opportunity.
Miller Industries (NYSE:MLR) Has Announced A Dividend Of $0.18The board of Miller Industries, Inc. ( NYSE:MLR ) has announced that it will pay a dividend on the 12th of June, with... |
Q1 2023 Miller Industries Inc Earnings CallQ1 2023 Miller Industries Inc Earnings Call |
MILLER INDUSTRIES REPORTS 2023 FIRST QUARTER RESULTSMiller Industries, Inc. (NYSE: MLR) (the "Company") today announced financial results for the first quarter ended March 31, 2023. |
MILLER INDUSTRIES TO ANNOUNCE FIRST QUARTER 2023 RESULTS ON WEDNESDAY MAY 3, 2023Miller Industries, Inc. (NYSE: MLR) intends to release its results for the First Quarter ended March 31, 2023, on Wednesday, May 3, 2023, after market close. The Company will host a conference call the following day that will be simultaneously broadcast live over the Internet: |
Should You Hold Miller Industries (MLR)?Palm Valley Capital Management, an investment management firm, released its first quarter 2023 investor letter. A copy of the same can be downloaded here. In the first quarter, Palm Valley Capital Fund returned 3.01% compared to a 2.57% rise for the S&P SmallCap 600 Index and a 4.90% return for the Morningstar Small Cap Index. The […] |
MLR Price Returns
1-mo | 4.23% |
3-mo | 22.82% |
6-mo | 24.61% |
1-year | 37.83% |
3-year | 22.79% |
5-year | 42.56% |
YTD | 28.12% |
2022 | -17.93% |
2021 | -10.51% |
2020 | 4.82% |
2019 | 40.68% |
2018 | 7.49% |
MLR Dividends
Ex-Dividend Date | Type | Payout Amount | Change | ||||||
---|---|---|---|---|---|---|---|---|---|
Loading, please wait... |
Continue Researching MLR
Want to see what other sources are saying about Miller Industries Inc's financials and stock price? Try the links below:Miller Industries Inc (MLR) Stock Price | Nasdaq
Miller Industries Inc (MLR) Stock Quote, History and News - Yahoo Finance
Miller Industries Inc (MLR) Stock Price and Basic Information | MarketWatch
Loading social stream, please wait...