Meta Materials Inc. (MMAT): Price and Financial Metrics
GET POWR RATINGS... FREE!
MMAT POWR Grades
- MMAT scores best on the Growth dimension, with a Growth rank ahead of 55.72% of US stocks.
- MMAT's strongest trending metric is Growth; it's been moving up over the last 179 days.
- MMAT's current lowest rank is in the Stability metric (where it is better than 0.13% of US stocks).
MMAT Stock Summary
- MMAT's price/sales ratio is 17.04; that's higher than the P/S ratio of 93.75% of US stocks.
- Over the past twelve months, MMAT has reported earnings growth of 321.85%, putting it ahead of 95.39% of US stocks in our set.
- As for revenue growth, note that MMAT's revenue has grown 819.57% over the past 12 months; that beats the revenue growth of 98.85% of US companies in our set.
- Stocks that are quantitatively similar to MMAT, based on their financial statements, market capitalization, and price volatility, are AXSM, LMND, WRAP, FLYW, and STEM.
- To check out META MATERIALS INC's SEC filings, go to the company's page on browse-edgar?action=getcompany&CIK=0001431959.
MMAT Valuation Summary
- In comparison to the median Technology stock, MMAT's price/earnings ratio is 109.28% lower, now standing at -2.2.
- Over the past 146 months, MMAT's price/sales ratio has gone NA NA.
Below are key valuation metrics over time for MMAT.
Stock | Date | P/S | P/B | P/E | EV/EBIT |
---|---|---|---|---|---|
MMAT | 2023-03-21 | 18.8 | 0.5 | -2.2 | -2.0 |
MMAT | 2023-03-20 | 17.3 | 0.5 | -2.0 | -1.8 |
MMAT | 2023-03-17 | 16.3 | 0.5 | -1.9 | -1.7 |
MMAT | 2023-03-16 | 16.2 | 0.5 | -1.9 | -1.7 |
MMAT | 2023-03-15 | 17.3 | 0.5 | -2.0 | -1.8 |
MMAT | 2023-03-14 | 17.8 | 0.5 | -2.1 | -1.8 |
MMAT Growth Metrics
- Its 2 year net cashflow from operations growth rate is now at -18250.85%.
- Its 4 year net income to common stockholders growth rate is now at -66.11%.
- Its 3 year revenue growth rate is now at 481%.

The table below shows MMAT's growth in key financial areas (numbers in millions of US dollars).
Date | Revenue | Operating Cash Flow | Net Income to Common Stock |
---|---|---|---|
2022-09-30 | 11.04372 | -67.69742 | -93.42281 |
2022-06-30 | 9.160316 | -58.16046 | -80.37274 |
2022-03-31 | 6.460909 | -49.9734 | -64.57137 |
2021-12-31 | 4.082517 | -34.76491 | -90.99726 |
2021-12-31 | 4.082517 | -34.76491 | -90.99726 |
2021-09-30 | 1.200963 | -15.62496 | -23.56616 |
MMAT's Quality Factors
The “Quality” component of the POWR Ratings focuses on 31 different factors of a companies fundamentals and operational strength. Here are some key insights as we drill into the specifics of these quality attributes.- MMAT has a Quality Grade of F, ranking ahead of 4.57% of graded US stocks.
- MMAT's asset turnover comes in at 0.005 -- ranking 203rd of 208 Electronic Equipment stocks.
- IRDM, VICR, and ITI are the stocks whose asset turnover ratios are most correlated with MMAT.
The table below shows MMAT's key quality metrics over time.
Period | Asset Turnover | Gross Margin | ROIC |
---|---|---|---|
2021-06-30 | 0.005 | 0.919 | -0.368 |
2021-03-31 | 0.003 | -0.215 | -0.250 |
2020-12-31 | 0.006 | 0.025 | -0.287 |
2020-09-30 | 0.009 | 0.171 | -0.309 |
2020-06-30 | 0.009 | -0.090 | -0.305 |
2020-03-31 | 0.013 | 0.247 | -0.243 |
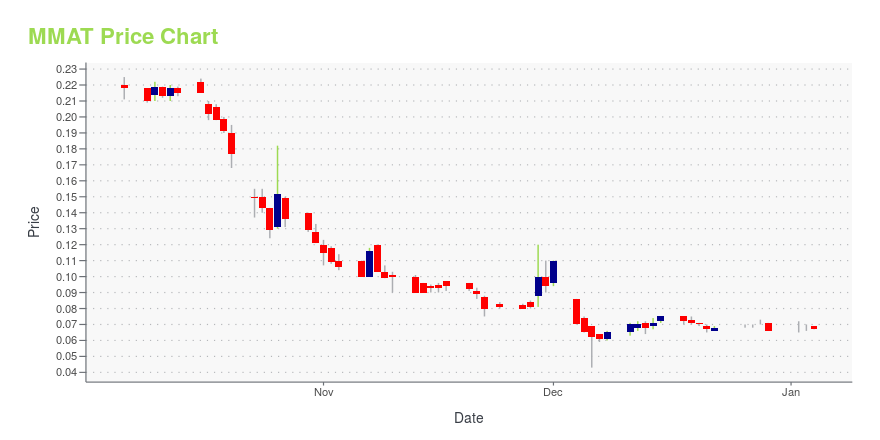
MMAT Stock Price Chart Interactive Chart >
MMAT Price/Volume Stats
Current price | $0.47 | 52-week high | $2.34 |
Prev. close | $0.46 | 52-week low | $0.45 |
Day low | $0.45 | Volume | 7,180,300 |
Day high | $0.48 | Avg. volume | 7,219,774 |
50-day MA | $0.76 | Dividend yield | N/A |
200-day MA | $1.04 | Market Cap | 171.49M |
Meta Materials Inc. (MMAT) Company Bio
Meta Materials, Inc. engages in the manufacture and development of functional materials. Its technology platform enables the global brands to deliver products to customers in consumer electronics, 5G communications, health and wellness, aerospace, automotive, and clean energy. The company was founded by George Palikaras and Themos Kallos on August 15, 2011 and is headquartered in Nova Scotia, Canada.
Latest MMAT News From Around the Web
Below are the latest news stories about META MATERIALS INC that investors may wish to consider to help them evaluate MMAT as an investment opportunity.
MMAT Stock Alert: Meta Materials Issues ‘Going Concern’ WarningMeta Materials just reported earnings for the year and cited a "going concern." |
Meta Materials Announces Q4 and FY 2022 ResultsMeta Materials Inc. (the "Company" or "META®") (NASDAQ:MMAT)(FSE:MMAT), a developer of high-performance functional materials and nanocomposites, today announced fourth quarter and FY 2022 results. |
Dear NVDA Stock Fans, Mark Your Calendars for March 21Nvidia (NVDA) stock is on the move Monday as investors prepare for the launch of the company's GTC conference and keynote tomorrow. |
MMAT Stock Alert: Meta Materials Signs New Battery AgreementMeta Materials (MMAT) stock is climbing higher on Monday after the company signed a new battery agreement with a global OEM. |
MMTLP Stock Alert: FINRA Releases Statement on MMTLP Trading HaltFINRA has finally issued a statement on the MMTLP stock trading halt. |
MMAT Price Returns
1-mo | -30.88% |
3-mo | -56.88% |
6-mo | -29.86% |
1-year | -74.73% |
3-year | -72.35% |
5-year | -82.46% |
YTD | -60.50% |
2022 | -51.63% |
2021 | 75.71% |
2020 | -53.95% |
2019 | 34.51% |
2018 | -15.67% |
Loading social stream, please wait...