Marsh & McLennan Cos. (MMC): Price and Financial Metrics
GET POWR RATINGS... FREE!
MMC POWR Grades
- MMC scores best on the Stability dimension, with a Stability rank ahead of 81.76% of US stocks.
- The strongest trend for MMC is in Momentum, which has been heading down over the past 177 days.
- MMC ranks lowest in Value; there it ranks in the 25th percentile.
MMC Stock Summary
- With a market capitalization of $86,960,386,592, MARSH & MCLENNAN COMPANIES INC has a greater market value than 97.49% of US stocks.
- MMC's went public 35.12 years ago, making it older than 90.7% of listed US stocks we're tracking.
- In terms of volatility of its share price, MMC is more volatile than just 3.81% of stocks we're observing.
- If you're looking for stocks that are quantitatively similar to MARSH & MCLENNAN COMPANIES INC, a group of peers worth examining would be MDLZ, INFY, ITW, BKNG, and TJX.
- Visit MMC's SEC page to see the company's official filings. To visit the company's web site, go to www.mmc.com.
MMC Valuation Summary
- In comparison to the median Financial Services stock, MMC's price/sales ratio is 41.38% higher, now standing at 4.1.
- MMC's price/earnings ratio has moved up 6.3 over the prior 243 months.
Below are key valuation metrics over time for MMC.
Stock | Date | P/S | P/B | P/E | EV/EBIT |
---|---|---|---|---|---|
MMC | 2023-01-23 | 4.1 | 9.0 | 25.4 | 20.3 |
MMC | 2023-01-20 | 4.1 | 9.0 | 25.4 | 20.3 |
MMC | 2023-01-19 | 4.0 | 8.8 | 24.8 | 19.9 |
MMC | 2023-01-18 | 4.0 | 8.8 | 24.7 | 19.9 |
MMC | 2023-01-17 | 4.1 | 8.9 | 25.2 | 20.2 |
MMC | 2023-01-13 | 4.1 | 9.0 | 25.4 | 20.3 |
MMC Growth Metrics
- The 5 year cash and equivalents growth rate now stands at 59.14%.
- The 3 year net cashflow from operations growth rate now stands at 28.06%.
- Its year over year net income to common stockholders growth rate is now at 43.92%.

The table below shows MMC's growth in key financial areas (numbers in millions of US dollars).
Date | Revenue | Operating Cash Flow | Net Income to Common Stock |
---|---|---|---|
2022-09-30 | 20,835 | 3,405 | 3,387 |
2022-06-30 | 20,648 | 3,346 | 3,378 |
2022-03-31 | 20,286 | 3,222 | 3,231 |
2021-12-31 | 19,820 | 3,516 | 3,143 |
2021-09-30 | 19,099 | 3,457 | 2,714 |
2021-06-30 | 18,484 | 3,554 | 2,493 |
MMC's Quality Factors
The “Quality” component of the POWR Ratings focuses on 31 different factors of a companies fundamentals and operational strength. Here are some key insights as we drill into the specifics of these quality attributes.- MMC has a Quality Grade of B, ranking ahead of 75.62% of graded US stocks.
- MMC's asset turnover comes in at 0.582 -- ranking 23rd of 133 Insurance stocks.
- HUM, KFS, and RNR are the stocks whose asset turnover ratios are most correlated with MMC.
The table below shows MMC's key quality metrics over time.
Period | Asset Turnover | Gross Margin | ROIC |
---|---|---|---|
2021-09-30 | 0.582 | 1 | 0.209 |
2021-06-30 | 0.565 | 1 | 0.194 |
2021-03-31 | 0.543 | 1 | 0.171 |
2020-12-31 | 0.533 | 1 | 0.154 |
2020-09-30 | 0.535 | 1 | 0.153 |
2020-06-30 | 0.542 | 1 | 0.150 |
MMC Price Target
For more insight on analysts targets of MMC, see our MMC price target page. And for a list of of all stocks sorted by upside potential based on analyst target price, see our Top Price Target page.
Average Price Target | $155.75 | Average Broker Recommendation | 1.77 (Moderate Buy) |
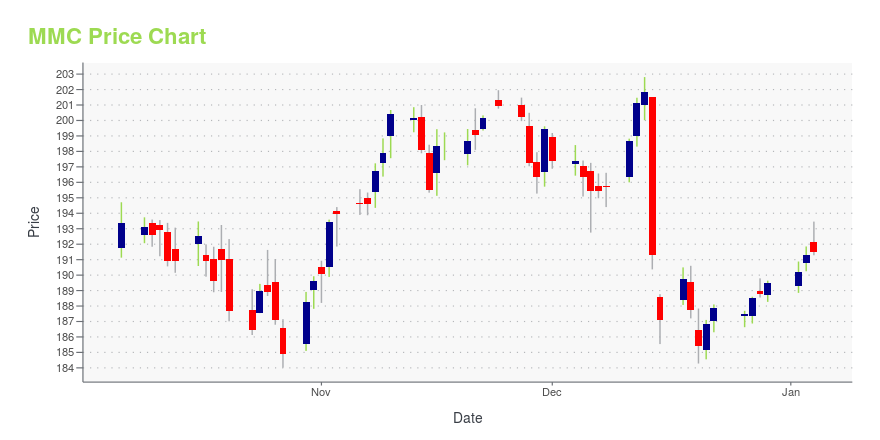
MMC Stock Price Chart Interactive Chart >
MMC Price/Volume Stats
Current price | $171.88 | 52-week high | $183.14 |
Prev. close | $175.32 | 52-week low | $143.33 |
Day low | $170.74 | Volume | 1,621,500 |
Day high | $174.46 | Avg. volume | 1,603,135 |
50-day MA | $170.54 | Dividend yield | 1.37% |
200-day MA | $162.05 | Market Cap | 85.25B |
Marsh & McLennan Cos. (MMC) Company Bio
Marsh McLennan (formerly known as Marsh & McLennan Companies) is a global professional services firm, headquartered in New York City with businesses in insurance brokerage, risk management, reinsurance services, talent management, investment advisory, and management consulting. Its four main operating companies are Marsh, Guy Carpenter, Mercer, and Oliver Wyman. (Source:Wikipedia)
Latest MMC News From Around the Web
Below are the latest news stories about MARSH & MCLENNAN COMPANIES INC that investors may wish to consider to help them evaluate MMC as an investment opportunity.
Marsh & McLennan Companies, Inc. (NYSE:MMC) Q4 2022 Earnings Call TranscriptMarsh & McLennan Companies, Inc. (NYSE:MMC) Q4 2022 Earnings Call Transcript January 26, 2023 President and Chief Executive Officer: Mark McGivney – Chief Financial Officer Martin South – President and CEO, Marsh Dean Klisura – President and CEO, Guy Carpenter Martine Ferland – President and CEO, Mercer Nick Studer – President and CEO, Oliver Wyman […] |
Marsh & McLennan Companies Full Year 2022 Earnings: EPS Misses ExpectationsMarsh & McLennan Companies ( NYSE:MMC ) Full Year 2022 Results Key Financial Results Revenue: US$20.7b (up 4.5% from FY... |
Marsh & McLennan Companies, Inc. (MMC) Q4 2022 Earnings Call TranscriptMarsh & McLennan Companies, Inc. (NYSE:NYSE:MMC) Q4 2022 Earnings Conference Call January 26, 2023 8:30 AM ETCompany ParticipantsSarah Dewitt - Head of Investor RelationsJohn Doyle -… |
Marsh & McLennan (MMC) Q4 Earnings Beat, Revenues Down Y/YMarsh & McLennan's (MMC) fourth-quarter results reflect sound contributions from the Consulting segment and well-performing international operations, partly offset by escalating operating costs. |
Marsh & McLennan Companies (MMC) Q4 2022 Earnings Call TranscriptFor more detailed discussion of those factors, please refer to our earnings release for this quarter and to our most recent SEC filings included in our most recent Form 10-K, all of which are available on the Marsh McLennan website. Also with us this morning is Sarah DeWitt, head of investor relations. |
MMC Price Returns
1-mo | 0.88% |
3-mo | 5.80% |
6-mo | 3.62% |
1-year | 13.74% |
3-year | 54.53% |
5-year | 127.12% |
YTD | 4.22% |
2022 | -3.45% |
2021 | 50.83% |
2020 | 6.86% |
2019 | 42.33% |
2018 | -0.14% |
MMC Dividends
Ex-Dividend Date | Type | Payout Amount | Change | ||||||
---|---|---|---|---|---|---|---|---|---|
Loading, please wait... |
Continue Researching MMC
Want to see what other sources are saying about Marsh & Mclennan Companies Inc's financials and stock price? Try the links below:Marsh & Mclennan Companies Inc (MMC) Stock Price | Nasdaq
Marsh & Mclennan Companies Inc (MMC) Stock Quote, History and News - Yahoo Finance
Marsh & Mclennan Companies Inc (MMC) Stock Price and Basic Information | MarketWatch
Loading social stream, please wait...