
Maximus, Inc. (MMS): Price and Financial Metrics
MMS Price/Volume Stats
| Current price | $92.52 | 52-week high | $93.06 |
| Prev. close | $91.65 | 52-week low | $72.39 |
| Day low | $91.86 | Volume | 301,125 |
| Day high | $93.06 | Avg. volume | 335,222 |
| 50-day MA | $87.22 | Dividend yield | 1.31% |
| 200-day MA | $82.86 | Market Cap | 5.62B |
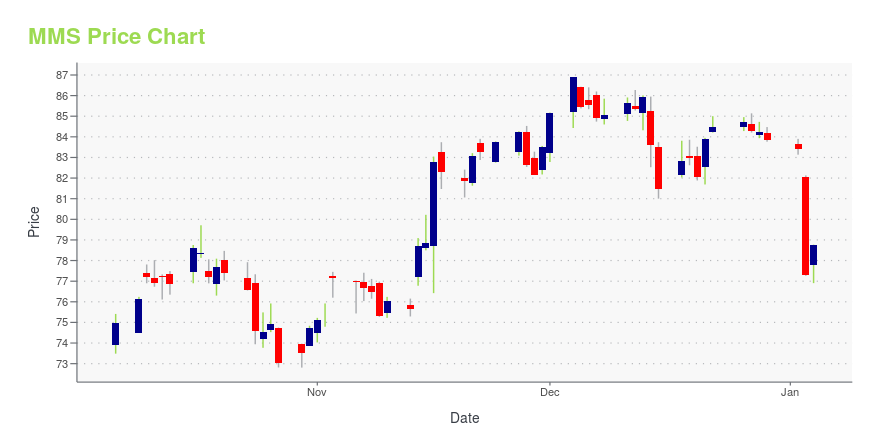
MMS Stock Price Chart Interactive Chart >
Maximus, Inc. (MMS) Company Bio
MAXIMUS Inc. provides business process services to government health and human services agencies in the United States, Australia, Canada, the United Kingdom, and Saudi Arabia. The company operates through two segments, Health Services and Human Services. The company was founded in 1975 and is based in Reston, Virginia.
Latest MMS News From Around the Web
Below are the latest news stories about MAXIMUS INC that investors may wish to consider to help them evaluate MMS as an investment opportunity.
Maximus DE&I Efforts Recognized in Third-Party Racial Equity AuditTYSONS, Va., December 22, 2023--Maximus shares results from a third-party racial equity audit finding on the company's diversity, equity, and inclusion (DE&I) efforts. |
Returns On Capital Signal Tricky Times Ahead For Maximus (NYSE:MMS)Did you know there are some financial metrics that can provide clues of a potential multi-bagger? Ideally, a business... |
Why Is Maximus (MMS) Up 1% Since Last Earnings Report?Maximus (MMS) reported earnings 30 days ago. What's next for the stock? We take a look at earnings estimates for some clues. |
Maximus Staff Show Their Generosity by Supporting ChildSaversNORTHAMPTON, MA / ACCESSWIRE / December 14, 2023 / MaximusChildSaversEvery Tuesday after Thanksgiving is designated as GivingTuesday, an annual celebration that encourages global generosity. The idea came to life in 2012 and has grown into a year-round ... |
Maximus Staff Show Their Generosity by Supporting the Catherine McAuley CenterNORTHAMPTON, MA / ACCESSWIRE / December 11, 2023 / MaximusCatherine McAuley CenterEvery Tuesday after Thanksgiving is designated as GivingTuesday, an annual celebration that encourages global generosity. The idea came to life in 2012 and has grown ... |
MMS Price Returns
| 1-mo | 6.31% |
| 3-mo | 15.44% |
| 6-mo | 11.70% |
| 1-year | 12.84% |
| 3-year | 10.15% |
| 5-year | 33.65% |
| YTD | 11.13% |
| 2023 | 16.01% |
| 2022 | -6.39% |
| 2021 | 10.31% |
| 2020 | -0.07% |
| 2019 | 15.90% |
MMS Dividends
| Ex-Dividend Date | Type | Payout Amount | Change | ||||||
|---|---|---|---|---|---|---|---|---|---|
| Loading, please wait... | |||||||||
Continue Researching MMS
Here are a few links from around the web to help you further your research on Maximus Inc's stock as an investment opportunity:Maximus Inc (MMS) Stock Price | Nasdaq
Maximus Inc (MMS) Stock Quote, History and News - Yahoo Finance
Maximus Inc (MMS) Stock Price and Basic Information | MarketWatch
Loading social stream, please wait...