
MainStreet Bancshares, Inc. (MNSB): Price and Financial Metrics
MNSB Price/Volume Stats
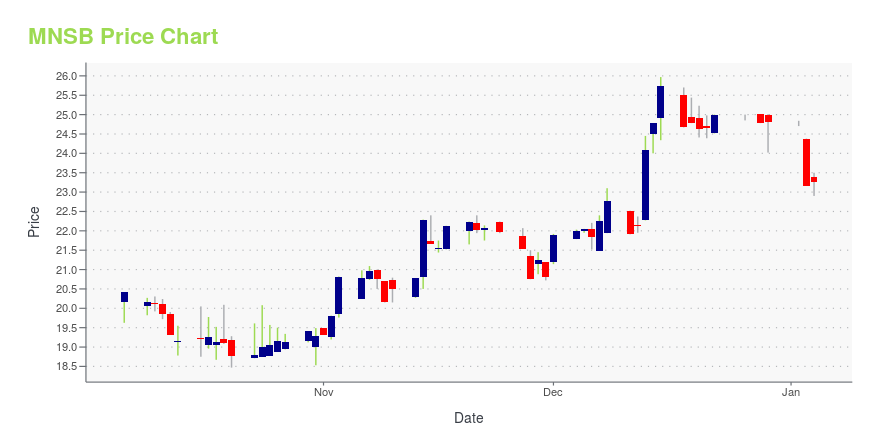
| Current price | $18.18 | 52-week high | $25.97 |
| Prev. close | $18.07 | 52-week low | $14.97 |
| Day low | $17.91 | Volume | 10,322 |
| Day high | $18.24 | Avg. volume | 28,862 |
| 50-day MA | $17.16 | Dividend yield | 2.21% |
| 200-day MA | $19.08 | Market Cap | 138.37M |
MNSB Stock Price Chart Interactive Chart >
MainStreet Bancshares, Inc. (MNSB) Company Bio
MainStreet Bancshares, Inc. provides a full range of commercial banking services for retail and institutional customers. The Bank offers personal and business banking services such as certificate of deposits, loans, credit cards, overdraft protection, and mortgages. MainStreet Bancshares conducts its business in the United States.
Latest MNSB News From Around the Web
Below are the latest news stories about MAINSTREET BANCSHARES INC that investors may wish to consider to help them evaluate MNSB as an investment opportunity.
CNB (CCNE) Soars 6.2%: Is Further Upside Left in the Stock?CNB (CCNE) witnessed a jump in share price last session on above-average trading volume. The latest trend in earnings estimate revisions for the stock doesn't suggest further strength down the road. |
MainStreet Bank Promotes Tom Floyd to Executive Vice PresidentMainStreet Bancshares, Inc. (Nasdaq: MNSB & MNSBP), the holding company for MainStreet Bank, promoted Tom Floyd to Executive Vice President. Floyd remains the Bank's Chief Lending Officer. |
MainStreet Bancshares, Inc. (NASDAQ:MNSB) is definitely on the radar of institutional investors who own 45% of the companyKey Insights Given the large stake in the stock by institutions, MainStreet Bancshares' stock price might be vulnerable... |
MainStreet Bank Listed in ICBA Independent Banker's "2023 Best Community Banks to Work For"MainStreet Bank and its parent company, MainStreet Bancshares, Inc. (Nasdaq: MNSB & MNSBP) are proud to report that the Independent Banker magazine - an award-winning monthly publication of the Independent Community Bankers of America (ICBA) - today named MainStreet Bank as a 2023 Best Community Banks to Work For recipient. The $2 billion-asset Bank received accolades for its culture that supports teamwork, professional growth, and community outreach. |
MainStreet Bancshares' (NASDAQ:MNSB) investors will be pleased with their decent 39% return over the last three yearsOne simple way to benefit from the stock market is to buy an index fund. But if you buy good businesses at attractive... |
MNSB Price Returns
| 1-mo | 0.78% |
| 3-mo | 15.06% |
| 6-mo | -15.31% |
| 1-year | -23.90% |
| 3-year | -21.50% |
| 5-year | -16.36% |
| YTD | -25.86% |
| 2023 | -8.16% |
| 2022 | 12.89% |
| 2021 | 45.42% |
| 2020 | -26.48% |
| 2019 | 34.82% |
MNSB Dividends
| Ex-Dividend Date | Type | Payout Amount | Change | ||||||
|---|---|---|---|---|---|---|---|---|---|
| Loading, please wait... | |||||||||
Loading social stream, please wait...