
Momentus Inc. (MNTS): Price and Financial Metrics
MNTS Price/Volume Stats
| Current price | $0.62 | 52-week high | $23.45 |
| Prev. close | $0.54 | 52-week low | $0.35 |
| Day low | $0.54 | Volume | 360,200 |
| Day high | $0.66 | Avg. volume | 2,126,240 |
| 50-day MA | $0.57 | Dividend yield | N/A |
| 200-day MA | $1.28 | Market Cap | 10.28M |
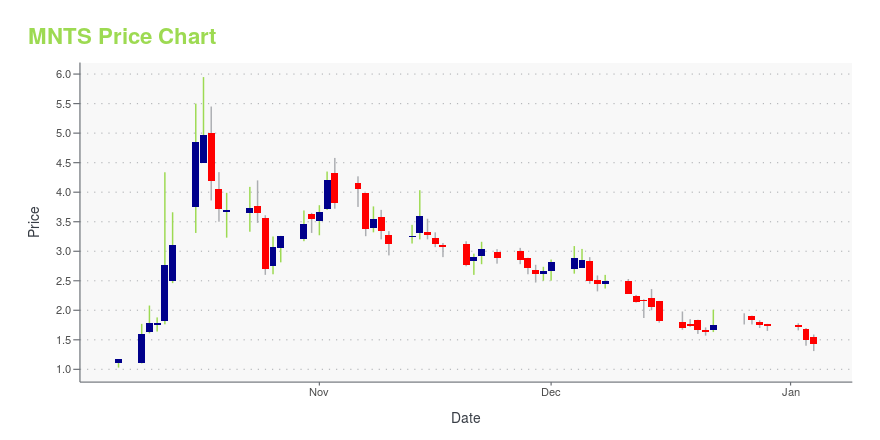
MNTS Stock Price Chart Interactive Chart >
Momentus Inc. (MNTS) Company Bio
Momentus Inc. provides water-powered transportation services for spacecraft. It engages in providing a shuttle service for satellites. Its shuttles, powered by water plasma engines, then transport these satellites to their target orbits. The company was incorporated in 2017 and is based in Santa Clara, California.
Latest MNTS News From Around the Web
Below are the latest news stories about MOMENTUS INC that investors may wish to consider to help them evaluate MNTS as an investment opportunity.
3 Stocks to Sell Before They Go to Zero Next YearThese are the stocks to sell if you want to avoid companies that continue to produce losses and destroy investor capital. |
Momentus Signs Contract with CalgaryToSpace for 2025 Orbital Delivery ServicesSAN JOSE, Calif., December 06, 2023--Momentus Inc. (NASDAQ: MNTS) ("Momentus" or the "Company"), a U.S. commercial space company that offers satellite buses, transportation, and other in-space infrastructure services, signed a contract with CalgaryToSpace (CTS) for transportation and orbital delivery services in 2025. |
Momentus Mission UpdateSAN JOSE, Calif., December 06, 2023--Momentus Inc. (NASDAQ: MNTS) ("Momentus" or the "Company"), a U.S. commercial space company that offers satellite buses and in-space infrastructure services including transportation, hosted payloads, and other in-orbit services, today announced an update on its latest mission that launched on the SpaceX Transporter-9 mission on November 11. |
Momentus Grants Inducement Award to One New EmployeeSAN JOSE, Calif., November 20, 2023--Momentus Inc. (NASDAQ: MNTS) ("Momentus" or the "Company"), a U.S. commercial space company that offers satellite buses, transportation and other in-space infrastructure services, today announced the granting of an inducement award to one new employee. In accordance with NASDAQ Listing Rule 5635(c)(4), the award was approved by Momentus’ Compensation Committee and made as a material inducement to such employee's entry into employment with the Company. |
Momentus Inc. Announces Third Quarter 2023 Financial ResultsSAN JOSE, Calif., November 14, 2023--Momentus Inc. (NASDAQ: MNTS) ("Momentus" or the "Company"), a U.S. commercial space company that offers satellite buses, transportation, and other in-space infrastructure services, today announced its financial results for the third quarter of 2023. |
MNTS Price Returns
| 1-mo | 13.55% |
| 3-mo | 30.36% |
| 6-mo | -20.53% |
| 1-year | -97.11% |
| 3-year | -99.88% |
| 5-year | N/A |
| YTD | -64.16% |
| 2023 | -95.56% |
| 2022 | -81.34% |
| 2021 | -76.73% |
| 2020 | N/A |
| 2019 | N/A |
Loading social stream, please wait...