
Manitex International, Inc. - common stock (MNTX): Price and Financial Metrics
MNTX Price/Volume Stats
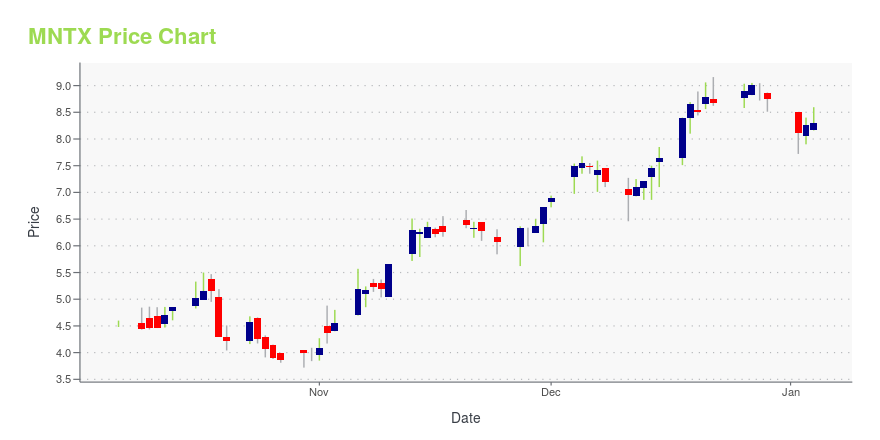
| Current price | $5.08 | 52-week high | $9.16 |
| Prev. close | $4.86 | 52-week low | $3.72 |
| Day low | $4.98 | Volume | 38,500 |
| Day high | $5.23 | Avg. volume | 71,338 |
| 50-day MA | $5.16 | Dividend yield | N/A |
| 200-day MA | $6.24 | Market Cap | 103.45M |
MNTX Stock Price Chart Interactive Chart >
Manitex International, Inc. - common stock (MNTX) Company Bio
Manitex International, Inc. provides engineered lifting and loading products worldwide. The company operates through Lifting Equipment, ASV, and Equipment Distribution segments. The company was founded in 1993 and is based in Bridgeview, Illinois.
Latest MNTX News From Around the Web
Below are the latest news stories about MANITEX INTERNATIONAL INC that investors may wish to consider to help them evaluate MNTX as an investment opportunity.
Owning 46% shares,institutional owners seem interested in Manitex International, Inc. (NASDAQ:MNTX),Key Insights Given the large stake in the stock by institutions, Manitex International's stock price might be... |
Is Manitex International, Inc. (NASDAQ:MNTX) Potentially Undervalued?Manitex International, Inc. ( NASDAQ:MNTX ), might not be a large cap stock, but it led the NASDAQCM gainers with a... |
Zacks.com featured highlights Direct Digital, Manitex, InterDigital, RCM Technologies and Barrett Business ServicesDirect Digital, Manitex, InterDigital, RCM Technologies and Barrett Business Services have been highlighted in this Screen of The Week article. |
Those who invested in Manitex International (NASDAQ:MNTX) three years ago are up 42%One simple way to benefit from the stock market is to buy an index fund. But many of us dare to dream of bigger... |
5 Stocks With Recent Price Strength to Enhance Your PortfolioInvestors target stocks that are witnessing a bullish run. Some of the stocks seeing price strength are DRCT, MNTX, IDCC, RCMT, BBSI. |
MNTX Price Returns
| 1-mo | 15.19% |
| 3-mo | -6.79% |
| 6-mo | -36.50% |
| 1-year | 2.63% |
| 3-year | -34.79% |
| 5-year | -19.87% |
| YTD | -41.88% |
| 2023 | 118.50% |
| 2022 | -37.11% |
| 2021 | 23.26% |
| 2020 | -13.28% |
| 2019 | 4.75% |
Continue Researching MNTX
Here are a few links from around the web to help you further your research on Manitex International Inc's stock as an investment opportunity:Manitex International Inc (MNTX) Stock Price | Nasdaq
Manitex International Inc (MNTX) Stock Quote, History and News - Yahoo Finance
Manitex International Inc (MNTX) Stock Price and Basic Information | MarketWatch
Loading social stream, please wait...