
Altria Group, Inc. (MO): Price and Financial Metrics
MO Price/Volume Stats
| Current price | $50.43 | 52-week high | $50.47 |
| Prev. close | $49.80 | 52-week low | $39.06 |
| Day low | $49.55 | Volume | 6,995,663 |
| Day high | $50.47 | Avg. volume | 10,724,506 |
| 50-day MA | $46.67 | Dividend yield | 7.98% |
| 200-day MA | $42.95 | Market Cap | 86.62B |
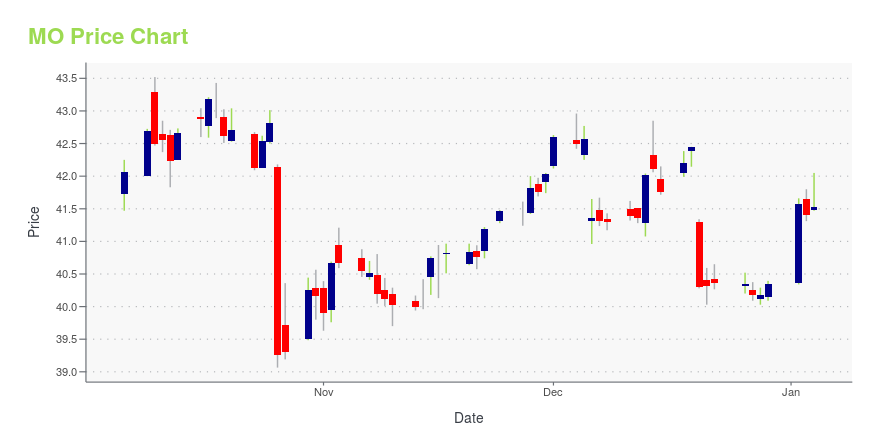
MO Stock Price Chart Interactive Chart >
Altria Group, Inc. (MO) Company Bio
Altria Group manufactures and sells cigarettes, smokeless products, and wine in the United States and internationally. The company was founded in 1919 and is based in Richmond, Virginia.
Latest MO News From Around the Web
Below are the latest news stories about ALTRIA GROUP INC that investors may wish to consider to help them evaluate MO as an investment opportunity.
2024’s Blue-Chip Winners: Top 3 Stocks for Rock-Solid ReturnsSome blue-chip stocks are poised to outperform others this year, so consider adding these to your portfolio. |
Want $500 in Super-Safe Dividend Income in 2024? Invest $4,850 Into the Following 3 Ultra-High-Yield Stocks.These three high-octane income stocks, which sport an average yield of 10.33%, have the tools and intangibles needed to make their patient shareholders notably richer. |
1 Fantastic Dividend Stock Yielding Nearly 10% to Buy Hand Over Fist for 2024Investing in this dividend stock could generate significant passive income for dividend stock investors in 2024 and beyond. |
Altria (MO) Stock Sinks As Market Gains: What You Should KnowAltria (MO) concluded the recent trading session at $40.18, signifying a -0.4% move from its prior day's close. |
High-Yield Heroes: The Top 3 Dividend Stocks in My PortfolioSimply pursuing yield can be a risky proposition but these high-yield dividend stocks also offer growth opportunities. |
MO Price Returns
| 1-mo | 8.78% |
| 3-mo | 18.80% |
| 6-mo | 31.05% |
| 1-year | 20.91% |
| 3-year | 35.10% |
| 5-year | 51.81% |
| YTD | 30.60% |
| 2023 | -3.70% |
| 2022 | 4.37% |
| 2021 | 24.18% |
| 2020 | -10.21% |
| 2019 | 7.87% |
MO Dividends
| Ex-Dividend Date | Type | Payout Amount | Change | ||||||
|---|---|---|---|---|---|---|---|---|---|
| Loading, please wait... | |||||||||
Continue Researching MO
Want to see what other sources are saying about Altria Group Inc's financials and stock price? Try the links below:Altria Group Inc (MO) Stock Price | Nasdaq
Altria Group Inc (MO) Stock Quote, History and News - Yahoo Finance
Altria Group Inc (MO) Stock Price and Basic Information | MarketWatch
Loading social stream, please wait...