Model N, Inc. (MODN): Price and Financial Metrics
GET POWR RATINGS... FREE!
MODN POWR Grades
- Quality is the dimension where MODN ranks best; there it ranks ahead of 91.49% of US stocks.
- MODN's strongest trending metric is Growth; it's been moving down over the last 177 days.
- MODN's current lowest rank is in the Value metric (where it is better than 21.69% of US stocks).
MODN Stock Summary
- With a one year PEG ratio of 344.92, MODEL N INC is expected to have a higher PEG ratio (a measure of how expensive a stock is relative to its expected earnings growth) than 92.25% of US stocks.
- The price/operating cash flow metric for MODEL N INC is higher than 92.51% of stocks in our set with a positive cash flow.
- With a price/sales ratio of 6.86, MODEL N INC has a higher such ratio than 82.42% of stocks in our set.
- Stocks that are quantitatively similar to MODN, based on their financial statements, market capitalization, and price volatility, are EB, ALKT, TWLO, ARLO, and QLGN.
- Visit MODN's SEC page to see the company's official filings. To visit the company's web site, go to www.modeln.com.
MODN Valuation Summary
- MODN's price/sales ratio is 6.8; this is 142.86% higher than that of the median Technology stock.
- MODN's EV/EBIT ratio has moved down 38.9 over the prior 120 months.
Below are key valuation metrics over time for MODN.
Stock | Date | P/S | P/B | P/E | EV/EBIT |
---|---|---|---|---|---|
MODN | 2023-01-31 | 6.8 | 11.0 | -51.7 | -116.2 |
MODN | 2023-01-30 | 6.9 | 11.3 | -53.1 | -119.3 |
MODN | 2023-01-27 | 7.2 | 11.7 | -55.0 | -123.6 |
MODN | 2023-01-26 | 7.2 | 11.7 | -55.2 | -124.1 |
MODN | 2023-01-25 | 7.1 | 11.5 | -54.1 | -121.7 |
MODN | 2023-01-24 | 7.0 | 11.4 | -53.8 | -120.9 |
MODN Growth Metrics
- Its 3 year cash and equivalents growth rate is now at 215.14%.
- Its 4 year cash and equivalents growth rate is now at 14.16%.
- The 3 year net cashflow from operations growth rate now stands at 141.94%.

The table below shows MODN's growth in key financial areas (numbers in millions of US dollars).
Date | Revenue | Operating Cash Flow | Net Income to Common Stock |
---|---|---|---|
2022-09-30 | 219.164 | 25.287 | -28.635 |
2022-06-30 | 212.475 | 27.233 | -26.592 |
2022-03-31 | 207.341 | 19.389 | -28.203 |
2021-12-31 | 202.253 | 10.126 | -30.85 |
2021-09-30 | 193.445 | 19.59 | -29.737 |
2021-06-30 | 183.424 | 16.874 | -27.325 |
MODN's Quality Factors
The “Quality” component of the POWR Ratings focuses on 31 different factors of a companies fundamentals and operational strength. Here are some key insights as we drill into the specifics of these quality attributes.- MODN has a Quality Grade of C, ranking ahead of 74.58% of graded US stocks.
- MODN's asset turnover comes in at 0.542 -- ranking 306th of 563 Business Services stocks.
- NCMI, TRIP, and AL are the stocks whose asset turnover ratios are most correlated with MODN.
The table below shows MODN's key quality metrics over time.
Period | Asset Turnover | Gross Margin | ROIC |
---|---|---|---|
2021-06-30 | 0.542 | 0.561 | -0.099 |
2021-03-31 | 0.533 | 0.579 | -0.076 |
2020-12-31 | 0.581 | 0.599 | -0.064 |
2020-09-30 | 0.661 | 0.593 | -0.105 |
2020-06-30 | 0.758 | 0.578 | -0.289 |
2020-03-31 | 0.878 | 0.561 | -0.657 |
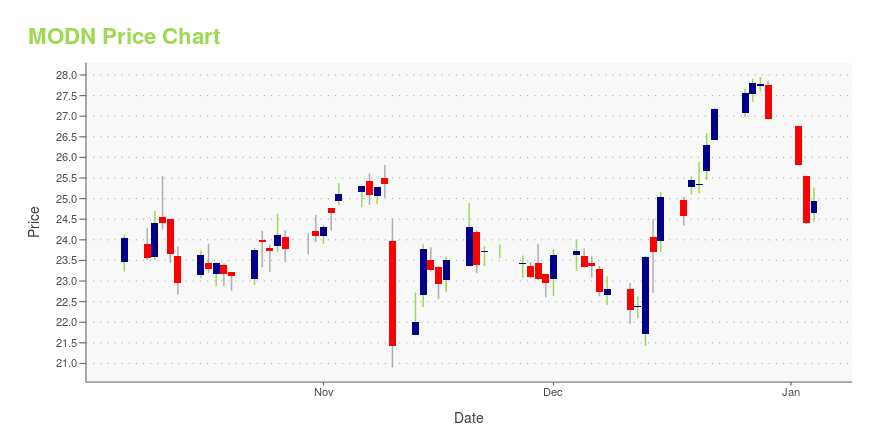
MODN Stock Price Chart Interactive Chart >
MODN Price/Volume Stats
Current price | $40.26 | 52-week high | $43.18 |
Prev. close | $40.39 | 52-week low | $20.95 |
Day low | $39.97 | Volume | 273,600 |
Day high | $40.78 | Avg. volume | 360,721 |
50-day MA | $40.41 | Dividend yield | N/A |
200-day MA | $32.00 | Market Cap | 1.52B |
Model N, Inc. (MODN) Company Bio
Model N, Inc. provides revenue management solutions for the life science and technology industries. It develops applications, such as managed care and government pricing for life science companies; and channel incentives based on design wins for technology companies. The company was founded in 1999 and is based in Redwood City, California.
Latest MODN News From Around the Web
Below are the latest news stories about MODEL N INC that investors may wish to consider to help them evaluate MODN as an investment opportunity.
Model N Announces State of Revenue Webinars for Life Sciences and High-Tech IndustriesSAN MATEO, Calif., January 30, 2023--Model N, Inc. (NYSE: MODN), the leader in revenue optimization and compliance, today announced its upcoming State of Revenue webinars on February 7 at 11 a.m. ET and 1 p.m. ET. The live webinars will coincide with the release of the company’s fifth annual State of Revenue Report. |
7 Tech Stocks to Buy as a New Bull Market EmergesInvestors seeking tech stocks to buy should remain aware that secular catalysts exist for certain pockets of the technology sector. |
7 Tech Stocks to Buy as a New Bull Market EmergesThe nearer we get to a market turnaround, the more investors look for tech stocks to buy. Many growth investors know that the same cyclicality that pummeled tech shares last year will lift them once the market flips. A bull market occurs when the prices of assets are in an upward trend. Of course, the impact of a potential recession and resurgent inflation could hamper the next bull market. Thus, whether the next bull market is emerging now, or will take more time to materialize, depends on thes |
The Zacks Analyst Blog Highlights America Movil, Model N, Richardson Electronics and eGainAmerica Movil, Model N, Richardson Electronics and eGain are part of the Zacks top Analyst Blog. |
Model N Announces Date of First Quarter Fiscal Year 2023 Financial ResultsSAN MATEO, Calif.--(BUSINESS WIRE)--Model N, Inc. (NYSE: MODN), the leader in revenue optimization and compliance, plans to announce financial results for the first quarter of fiscal year 2023 after market close on Tuesday, February 7, 2023. The company also plans to host a conference call that day at 2:00 p.m. PT (5:00 p.m. ET) to review its financial results and business outlook. The conference call can be accessed by dialing 877-407-4018 from the United States or +1-201-689-8471 internationa |
MODN Price Returns
1-mo | -0.25% |
3-mo | 11.31% |
6-mo | 19.18% |
1-year | 55.50% |
3-year | 27.41% |
5-year | 131.38% |
YTD | -0.74% |
2022 | 35.06% |
2021 | -15.84% |
2020 | 1.74% |
2019 | 165.08% |
2018 | -16.00% |
Continue Researching MODN
Want to see what other sources are saying about Model N Inc's financials and stock price? Try the links below:Model N Inc (MODN) Stock Price | Nasdaq
Model N Inc (MODN) Stock Quote, History and News - Yahoo Finance
Model N Inc (MODN) Stock Price and Basic Information | MarketWatch
Loading social stream, please wait...