
Morningstar, Inc. (MORN): Price and Financial Metrics
MORN Price/Volume Stats
| Current price | $326.31 | 52-week high | $330.22 |
| Prev. close | $322.67 | 52-week low | $213.38 |
| Day low | $319.96 | Volume | 140,323 |
| Day high | $327.50 | Avg. volume | 119,227 |
| 50-day MA | $297.83 | Dividend yield | 0.52% |
| 200-day MA | $285.34 | Market Cap | 13.95B |
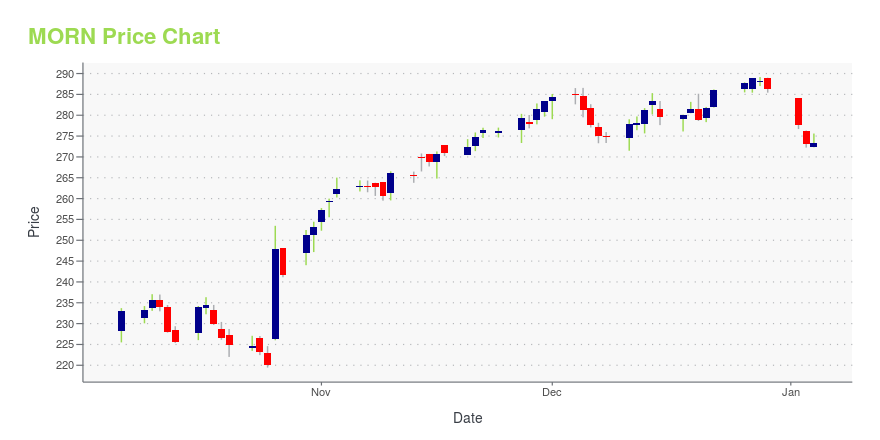
MORN Stock Price Chart Interactive Chart >
Morningstar, Inc. (MORN) Company Bio
Morningstar provides independent investment research services, including data on stocks, mutual funds, and similar vehicles, and real-time global market data covering equities, indexes, futures, options, commodities, and precious metals. The company was founded in 1984 and is based in Chicago, Illinois.
Latest MORN News From Around the Web
Below are the latest news stories about MORNINGSTAR INC that investors may wish to consider to help them evaluate MORN as an investment opportunity.
Morningstar Direct Web Services Brings Sophisticated Investment Data, Research, and Calculation APIs to Power Firms' Digital PlatformsMorningstar, Inc. (Nasdaq: MORN), a leading provider of independent investment insights, today announced the launch of Direct Web Services, a collection of application programming interfaces (APIs) that packages Morningstar's data, research, and calculation engines for financial services firms to use in their own digital solutions. Direct Web Services is complemented by a newly created global network of certified partners to seamlessly integrate API functionality for firms developing sophisticat |
Momentum Investing Has Struggled for 20 Years. Here’s Why.A mutual-funds rating company changed its methodology over a decade ago, and that apparently has made all the difference. |
Morningstar, Inc. Declares Quarterly Dividend of 40.5 Cents Per ShareThe board of directors of Morningstar, Inc. (Nasdaq: MORN), a leading provider of independent investment research, today declared a quarterly dividend of 40.5 cents per share, an increase of 8 percent. The dividend is payable Jan. 31, 2024, to shareholders of record as of Jan. 5, 2024. The 3-cent increase from the prior quarterly rate of 37.5 cents per share results in an annualized dividend of $1.62 per share compared with the prior annualized rate of $1.50 per share. |
Scoring Big: 3 Football Stocks to Keep an Eye On This ThanksgivingBet big this Thanksgiving with these three football stocks that stand to gain from investor enthusiasm and company strength. |
What Makes Morningstar (MORN) a Prospective Investment?Polen Capital, an investment management company, released its “Polen Global SMID Company Growth Strategy” third-quarter 2023 investor letter. A copy of the same can be downloaded here. The fund returned -6.59% gross and -6.64% net of fees compared to -3.55% return for the MSCI ACWI SMID Capitalization Index. Negative security selection drove the underperformance of the […] |
MORN Price Returns
| 1-mo | 10.80% |
| 3-mo | 14.13% |
| 6-mo | 18.74% |
| 1-year | 42.46% |
| 3-year | 36.01% |
| 5-year | 117.12% |
| YTD | 14.47% |
| 2023 | 33.10% |
| 2022 | -36.31% |
| 2021 | 48.23% |
| 2020 | 54.54% |
| 2019 | 38.93% |
MORN Dividends
| Ex-Dividend Date | Type | Payout Amount | Change | ||||||
|---|---|---|---|---|---|---|---|---|---|
| Loading, please wait... | |||||||||
Continue Researching MORN
Want to see what other sources are saying about Morningstar Inc's financials and stock price? Try the links below:Morningstar Inc (MORN) Stock Price | Nasdaq
Morningstar Inc (MORN) Stock Quote, History and News - Yahoo Finance
Morningstar Inc (MORN) Stock Price and Basic Information | MarketWatch
Loading social stream, please wait...