Everspin Technologies, Inc. (MRAM): Price and Financial Metrics
GET POWR RATINGS... FREE!
MRAM POWR Grades
- MRAM scores best on the Sentiment dimension, with a Sentiment rank ahead of 97.83% of US stocks.
- The strongest trend for MRAM is in Stability, which has been heading up over the past 177 days.
- MRAM's current lowest rank is in the Growth metric (where it is better than 2.08% of US stocks).
MRAM Stock Summary
- MRAM has a higher market value than only 23.86% of US stocks; more precisely, its current market capitalization is $130,415,213.
- Equity multiplier, or assets relative to shareholders' equity, comes in at 1.42 for EVERSPIN TECHNOLOGIES INC; that's greater than it is for just 23.15% of US stocks.
- With a year-over-year growth in debt of 63.35%, EVERSPIN TECHNOLOGIES INC's debt growth rate surpasses 84.34% of about US stocks.
- Stocks with similar financial metrics, market capitalization, and price volatility to EVERSPIN TECHNOLOGIES INC are ASTC, VRCA, PLSE, NSPR, and QUIK.
- MRAM's SEC filings can be seen here. And to visit EVERSPIN TECHNOLOGIES INC's official web site, go to www.everspin.com.
MRAM Valuation Summary
- MRAM's EV/EBIT ratio is 17.6; this is 7.85% lower than that of the median Technology stock.
- MRAM's price/sales ratio has moved down 1.5 over the prior 79 months.
Below are key valuation metrics over time for MRAM.
Stock | Date | P/S | P/B | P/E | EV/EBIT |
---|---|---|---|---|---|
MRAM | 2023-03-21 | 2.2 | 3.4 | 21.3 | 17.6 |
MRAM | 2023-03-20 | 2.1 | 3.3 | 21.0 | 17.3 |
MRAM | 2023-03-17 | 2.2 | 3.3 | 21.1 | 17.4 |
MRAM | 2023-03-16 | 2.2 | 3.3 | 21.1 | 17.4 |
MRAM | 2023-03-15 | 2.1 | 3.2 | 20.5 | 16.8 |
MRAM | 2023-03-14 | 2.1 | 3.3 | 20.9 | 17.2 |
MRAM Growth Metrics
- The 3 year price growth rate now stands at -25.45%.
- The 4 year cash and equivalents growth rate now stands at -53.07%.
- Its 5 year revenue growth rate is now at 38.72%.

The table below shows MRAM's growth in key financial areas (numbers in millions of US dollars).
Date | Revenue | Operating Cash Flow | Net Income to Common Stock |
---|---|---|---|
2022-09-30 | 62.518 | 10.679 | 9.18 |
2022-06-30 | 62.072 | 11.628 | 8.153 |
2022-03-31 | 59.213 | 6.737 | 6.738 |
2021-12-31 | 55.146 | 9.359 | 4.343 |
2021-09-30 | 46.9 | 3.552 | -0.915 |
2021-06-30 | 42.225 | 2.358 | -5.69 |
MRAM's Quality Factors
The “Quality” component of the POWR Ratings focuses on 31 different factors of a companies fundamentals and operational strength. Here are some key insights as we drill into the specifics of these quality attributes.- MRAM has a Quality Grade of C, ranking ahead of 65.06% of graded US stocks.
- MRAM's asset turnover comes in at 1.247 -- ranking 28th of 208 Electronic Equipment stocks.
- VREX, GSIT, and ESE are the stocks whose asset turnover ratios are most correlated with MRAM.
The table below shows MRAM's key quality metrics over time.
Period | Asset Turnover | Gross Margin | ROIC |
---|---|---|---|
2021-06-30 | 1.247 | 0.491 | -0.265 |
2021-03-31 | 1.242 | 0.444 | -0.309 |
2020-12-31 | 1.241 | 0.430 | -0.335 |
2020-09-30 | 1.206 | 0.433 | -0.385 |
2020-06-30 | 1.163 | 0.492 | -0.365 |
2020-03-31 | 1.054 | 0.503 | -0.488 |
MRAM Price Target
For more insight on analysts targets of MRAM, see our MRAM price target page. And for a list of of all stocks sorted by upside potential based on analyst target price, see our Top Price Target page.
Average Price Target | $9.25 | Average Broker Recommendation | 1.25 (Strong Buy) |
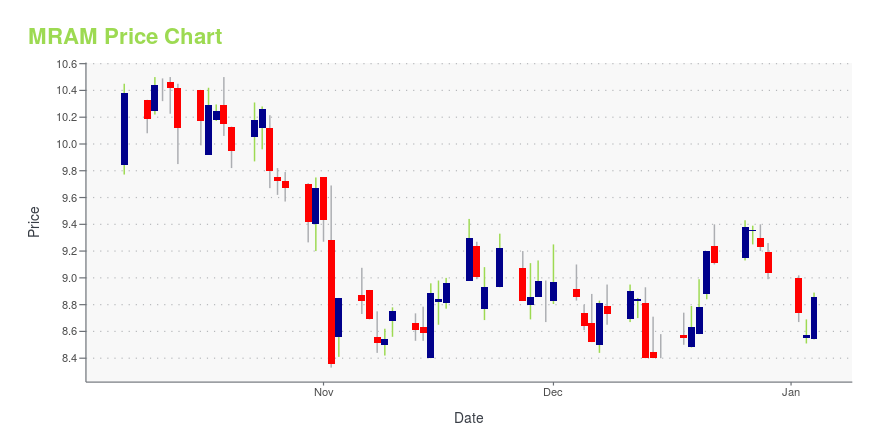
MRAM Stock Price Chart Interactive Chart >
MRAM Price/Volume Stats
Current price | $6.81 | 52-week high | $9.41 |
Prev. close | $6.54 | 52-week low | $4.71 |
Day low | $6.59 | Volume | 37,200 |
Day high | $6.87 | Avg. volume | 64,010 |
50-day MA | $6.78 | Dividend yield | N/A |
200-day MA | $6.23 | Market Cap | 139.20M |
Everspin Technologies, Inc. (MRAM) Company Bio
Everspin Technologies, Inc. manufactures and sells magnetoresistive random access memory products to customers in the United States and internationally. The company provides its products for applications, including industrial, automotive, transportation, and enterprise storage applications.
Latest MRAM News From Around the Web
Below are the latest news stories about EVERSPIN TECHNOLOGIES INC that investors may wish to consider to help them evaluate MRAM as an investment opportunity.
Some Confidence Is Lacking In Everspin Technologies, Inc.'s (NASDAQ:MRAM) P/EWith a price-to-earnings (or "P/E") ratio of 21.1x Everspin Technologies, Inc. ( NASDAQ:MRAM ) may be sending bearish... |
Everspin Technologies, Inc. (NASDAQ:MRAM) Q4 2022 Earnings Call TranscriptEverspin Technologies, Inc. (NASDAQ:MRAM) Q4 2022 Earnings Call Transcript March 1, 2023 Analysts: Richard Shannon – Craig-Hallum Rajvindra Gill – Needham & Company John Fichthorn – Dialectic Capital Operator: Good afternoon and welcome to the Conference Call to discuss Everspin Technologies Fourth Quarter and Full Year 2022 Results. At this time, all participants are in […] |
Everspin Technologies Full Year 2022 Earnings: Beats ExpectationsEverspin Technologies ( NASDAQ:MRAM ) Full Year 2022 Results Key Financial Results Revenue: US$60.0m (up 8.8% from FY... |
Everspin Technologies, Inc. (MRAM) Q4 2022 Earnings Call TranscriptEverspin Technologies, Inc. (MRAM) Q4 2022 Earnings Conference Call March 1, 2023 5:00 PM ET Participants Sanjeev Aggarwal - President and Chief Executive Officer Anuj Aggarwal - Chief Financial Officer Analysts Richard Shannon - Craig-Hallum Rajvindra Gill - Needham & Company John Fichthorn - Dialectic Capital Presentation Operator Good afternoon and welcome to the Conference Call to discuss Everspin Technologies Fourth Quarter and Full Year 2022 Results. At this time, all participants are in a listen-only mode. At the conclusion of today’s conference call, instructions will be given for a question-and-answer session. As a reminder, this cal... |
Q4 2022 Everspin Technologies Inc Earnings CallQ4 2022 Everspin Technologies Inc Earnings Call |
MRAM Price Returns
1-mo | -1.30% |
3-mo | 22.48% |
6-mo | 17.62% |
1-year | -21.72% |
3-year | 159.92% |
5-year | -9.80% |
YTD | 22.48% |
2022 | -50.80% |
2021 | 145.65% |
2020 | -12.55% |
2019 | -6.24% |
2018 | -25.20% |
Continue Researching MRAM
Want to see what other sources are saying about Everspin Technologies Inc's financials and stock price? Try the links below:Everspin Technologies Inc (MRAM) Stock Price | Nasdaq
Everspin Technologies Inc (MRAM) Stock Quote, History and News - Yahoo Finance
Everspin Technologies Inc (MRAM) Stock Price and Basic Information | MarketWatch
Loading social stream, please wait...