
MRC Global Inc. (MRC): Price and Financial Metrics
MRC Price/Volume Stats
| Current price | $14.85 | 52-week high | $14.91 |
| Prev. close | $14.58 | 52-week low | $8.15 |
| Day low | $14.58 | Volume | 457,300 |
| Day high | $14.91 | Avg. volume | 617,352 |
| 50-day MA | $13.15 | Dividend yield | N/A |
| 200-day MA | $11.69 | Market Cap | 1.26B |
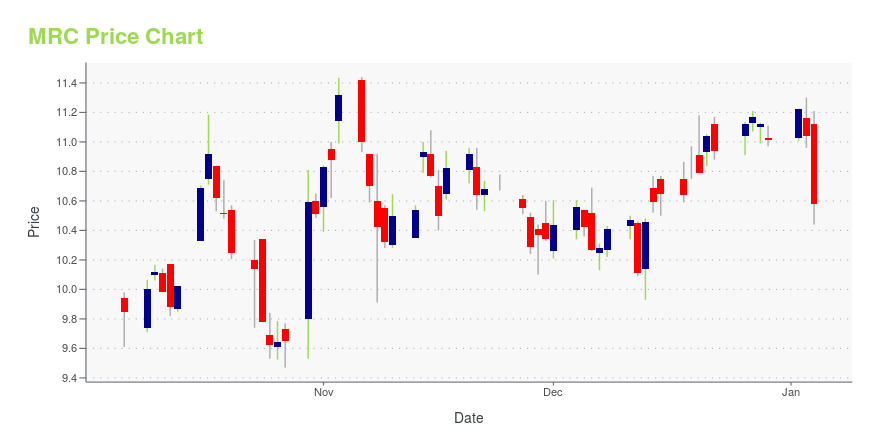
MRC Stock Price Chart Interactive Chart >
MRC Global Inc. (MRC) Company Bio
MRC Global distributes pipes, valves, fittings, and related products and services to the energy and industrial sectors. The company was founded in 1921 and is based in Houston, Texas.
Latest MRC News From Around the Web
Below are the latest news stories about MRC GLOBAL INC that investors may wish to consider to help them evaluate MRC as an investment opportunity.
MRC Global (MRC) Gains From Business Strength Amid RisksMRC Global (MRC) benefits from its presence across diversified businesses and increased customer infrastructure activity in the Permian basin. However, higher operating costs and expenses remain a concern. |
MRC Global Announces Fourth Quarter and Full Year 2023 Earnings Release, Conference Call and Webcast ScheduleHOUSTON, Dec. 15, 2023 (GLOBE NEWSWIRE) -- MRC Global Inc. (NYSE: MRC) will release its fourth quarter and full year 2023 results on February 13, 2024, after the market closes. In conjunction with the release, the company will host a conference call and webcast: What:MRC Global Fourth Quarter and Full Year 2023 Earnings Conference Call and Webcast When:Wednesday, February 14, 2024, at 10:00 a.m. Eastern / 9:00 a.m. Central How:Via phone – Dial 201-689-8261 and ask for the MRC Global call prior t |
Why Is MRC (MRC) Down 1.4% Since Last Earnings Report?MRC (MRC) reported earnings 30 days ago. What's next for the stock? We take a look at earnings estimates for some clues. |
MRC Global (NYSE:MRC) shareholders have earned a 19% CAGR over the last three yearsBy buying an index fund, investors can approximate the average market return. But if you pick the right individual... |
MRC Global Inc. (NYSE:MRC) Q3 2023 Earnings Call TranscriptMRC Global Inc. (NYSE:MRC) Q3 2023 Earnings Call Transcript November 8, 2023 Operator: Greetings, and welcome to MRC Global’s Third Quarter 2023 Earnings Conference Call. [Operator Instructions]. As a reminder, this conference is being recorded. It is now my pleasure to introduce Monica Broughton, Vice President, Investor Relations and Treasury. Thank you. You may begin. […] |
MRC Price Returns
| 1-mo | 20.34% |
| 3-mo | 28.02% |
| 6-mo | 42.65% |
| 1-year | 34.75% |
| 3-year | 66.29% |
| 5-year | -6.31% |
| YTD | 34.88% |
| 2023 | -4.92% |
| 2022 | 68.31% |
| 2021 | 3.77% |
| 2020 | -51.39% |
| 2019 | 11.53% |
Continue Researching MRC
Want to do more research on Mrc Global Inc's stock and its price? Try the links below:Mrc Global Inc (MRC) Stock Price | Nasdaq
Mrc Global Inc (MRC) Stock Quote, History and News - Yahoo Finance
Mrc Global Inc (MRC) Stock Price and Basic Information | MarketWatch
Loading social stream, please wait...