Mercury Systems Inc (MRCY): Price and Financial Metrics
GET POWR RATINGS... FREE!
MRCY POWR Grades
- Growth is the dimension where MRCY ranks best; there it ranks ahead of 66.38% of US stocks.
- The strongest trend for MRCY is in Growth, which has been heading down over the past 179 days.
- MRCY ranks lowest in Sentiment; there it ranks in the 25th percentile.
MRCY Stock Summary
- MRCY's one year PEG ratio, measuring expected growth in earnings next year relative to current common stock price is 1,191.4 -- higher than 97.47% of US-listed equities with positive expected earnings growth.
- Of note is the ratio of MERCURY SYSTEMS INC's sales and general administrative expense to its total operating expenses; merely 24.18% of US stocks have a lower such ratio.
- In terms of twelve month growth in earnings before interest and taxes, MERCURY SYSTEMS INC is reporting a growth rate of -54.82%; that's higher than only 22.75% of US stocks.
- If you're looking for stocks that are quantitatively similar to MERCURY SYSTEMS INC, a group of peers worth examining would be INFA, FSLR, PRGS, IPGP, and AVDX.
- MRCY's SEC filings can be seen here. And to visit MERCURY SYSTEMS INC's official web site, go to www.mrcy.com.
MRCY Valuation Summary
- MRCY's price/sales ratio is 2.7; this is 145.45% higher than that of the median Industrials stock.
- Over the past 243 months, MRCY's price/sales ratio has gone down 0.9.
Below are key valuation metrics over time for MRCY.
Stock | Date | P/S | P/B | P/E | EV/EBIT |
---|---|---|---|---|---|
MRCY | 2023-03-17 | 2.7 | 1.7 | -639.2 | 204.1 |
MRCY | 2023-03-16 | 2.8 | 1.8 | -658.5 | 209.3 |
MRCY | 2023-03-15 | 2.8 | 1.8 | -669.5 | 212.3 |
MRCY | 2023-03-14 | 2.9 | 1.9 | -689.1 | 217.6 |
MRCY | 2023-03-13 | 2.8 | 1.8 | -665.2 | 211.1 |
MRCY | 2023-03-10 | 2.9 | 1.9 | -689.5 | 217.7 |
MRCY Growth Metrics
- Its year over year revenue growth rate is now at 6.6%.
- The 2 year revenue growth rate now stands at 25.54%.
- The 5 year net income to common stockholders growth rate now stands at 190.58%.

The table below shows MRCY's growth in key financial areas (numbers in millions of US dollars).
Date | Revenue | Operating Cash Flow | Net Income to Common Stock |
---|---|---|---|
2022-12-31 | 999.971 | -54.334 | -4.201 |
2022-09-30 | 990.763 | -82.902 | 4.08 |
2022-06-30 | 988.197 | -18.869 | 11.275 |
2022-03-31 | 949.31 | 27.76 | 12.285 |
2021-12-31 | 953.092 | 55.197 | 23.781 |
2021-09-30 | 943.388 | 72.312 | 39.106 |
MRCY's Quality Factors
The “Quality” component of the POWR Ratings focuses on 31 different factors of a companies fundamentals and operational strength. Here are some key insights as we drill into the specifics of these quality attributes.- MRCY has a Quality Grade of C, ranking ahead of 57.31% of graded US stocks.
- MRCY's asset turnover comes in at 0.495 -- ranking 146th of 208 Electronic Equipment stocks.
- CASA, BHE, and BELFA are the stocks whose asset turnover ratios are most correlated with MRCY.
The table below shows MRCY's key quality metrics over time.
Period | Asset Turnover | Gross Margin | ROIC |
---|---|---|---|
2021-07-02 | 0.495 | 0.417 | 0.110 |
2021-04-02 | 0.501 | 0.426 | 0.135 |
2021-01-01 | 0.482 | 0.436 | 0.152 |
2020-10-02 | 0.504 | 0.444 | 0.179 |
2020-07-03 | 0.500 | 0.448 | 0.186 |
2020-03-27 | 0.490 | 0.450 | 0.178 |
MRCY Price Target
For more insight on analysts targets of MRCY, see our MRCY price target page. And for a list of of all stocks sorted by upside potential based on analyst target price, see our Top Price Target page.
Average Price Target | $67.63 | Average Broker Recommendation | 1.75 (Moderate Buy) |
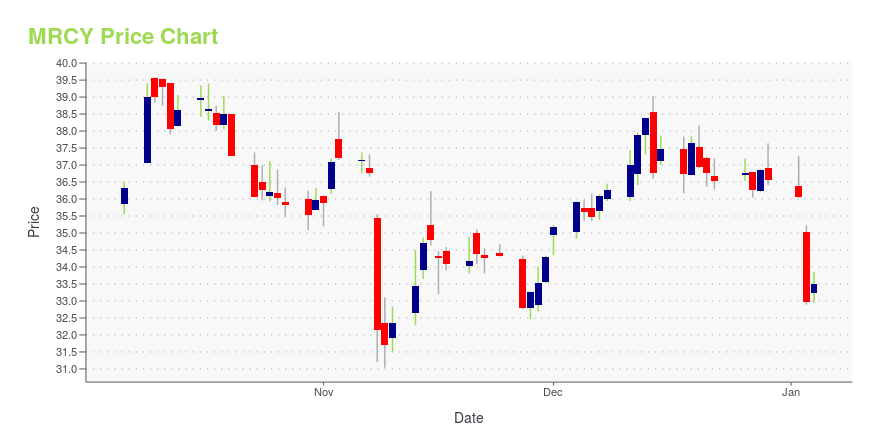
MRCY Stock Price Chart Interactive Chart >
MRCY Price/Volume Stats
Current price | $49.00 | 52-week high | $68.38 |
Prev. close | $47.75 | 52-week low | $40.48 |
Day low | $47.01 | Volume | 295,200 |
Day high | $49.16 | Avg. volume | 328,768 |
50-day MA | $51.15 | Dividend yield | N/A |
200-day MA | $50.87 | Market Cap | 2.85B |
Mercury Systems Inc (MRCY) Company Bio
Mercury Systems provides open sensor processing systems and services. The company operates through two segments, Mercury Commercial Electronics (MCE) and Mercury Defense Systems (MDS). The company was founded in 1981 and is based in Chelmsford, Massachusetts.
Latest MRCY News From Around the Web
Below are the latest news stories about MERCURY SYSTEMS INC that investors may wish to consider to help them evaluate MRCY as an investment opportunity.
Mercury Systems Appoints Christine Fox Harbison as Executive Vice President and Chief Growth OfficerChristine Fox Harbison, Mercury EVP and Chief Growth Officer Christine Fox Harbison, Mercury EVP and Chief Growth Officer ANDOVER, Mass., March 02, 2023 (GLOBE NEWSWIRE) -- Mercury Systems, Inc., (NASDAQ: MRCY, www.mrcy.com), a technology company that delivers processing power for the most demanding aerospace and defense missions, today announced the appointment of Christine Fox Harbison as Executive Vice President and Chief Growth Officer, effective March 6, 2023. Reporting to Mercury CEO Mark |
Why Is Mercury Systems (MRCY) Down 5.1% Since Last Earnings Report?Mercury Systems (MRCY) reported earnings 30 days ago. What's next for the stock? We take a look at earnings estimates for some clues. |
APELY or MRCY: Which Is the Better Value Stock Right Now?APELY vs. MRCY: Which Stock Is the Better Value Option? |
Mercury Systems Hosts U.S. Representative Dale Strong at its Huntsville FacilityU.S. Rep. Dale Strong U.S. Rep. Dale Strong (center) visited Mercury's Huntsville facility on February 15, 2023. ANDOVER, Mass., Feb. 16, 2023 (GLOBE NEWSWIRE) -- Mercury Systems, Inc., (NASDAQ: MRCY, www.mrcy.com), a technology company that delivers processing power for the most demanding aerospace and defense missions, welcomed U.S. Rep. Dale Strong to its Huntsville, Alabama, facility to showcase how it enables its customers to accelerate innovation and turn data into decision superiority. “F |
Mercury Systems (NASDAQ:MRCY) Could Be Struggling To Allocate CapitalIf we want to find a stock that could multiply over the long term, what are the underlying trends we should look for... |
MRCY Price Returns
1-mo | -8.62% |
3-mo | N/A |
6-mo | 17.93% |
1-year | -26.25% |
3-year | -35.20% |
5-year | 3.88% |
YTD | 9.52% |
2022 | -18.74% |
2021 | -37.47% |
2020 | 27.42% |
2019 | 46.14% |
2018 | -7.91% |
Continue Researching MRCY
Want to do more research on Mercury Systems Inc's stock and its price? Try the links below:Mercury Systems Inc (MRCY) Stock Price | Nasdaq
Mercury Systems Inc (MRCY) Stock Quote, History and News - Yahoo Finance
Mercury Systems Inc (MRCY) Stock Price and Basic Information | MarketWatch
Loading social stream, please wait...