
Marin Software Incorporated (MRIN): Price and Financial Metrics
MRIN Price/Volume Stats
| Current price | $2.42 | 52-week high | $5.45 |
| Prev. close | $2.47 | 52-week low | $1.44 |
| Day low | $2.38 | Volume | 22,801 |
| Day high | $2.50 | Avg. volume | 522,094 |
| 50-day MA | $2.45 | Dividend yield | N/A |
| 200-day MA | $2.28 | Market Cap | 7.52M |
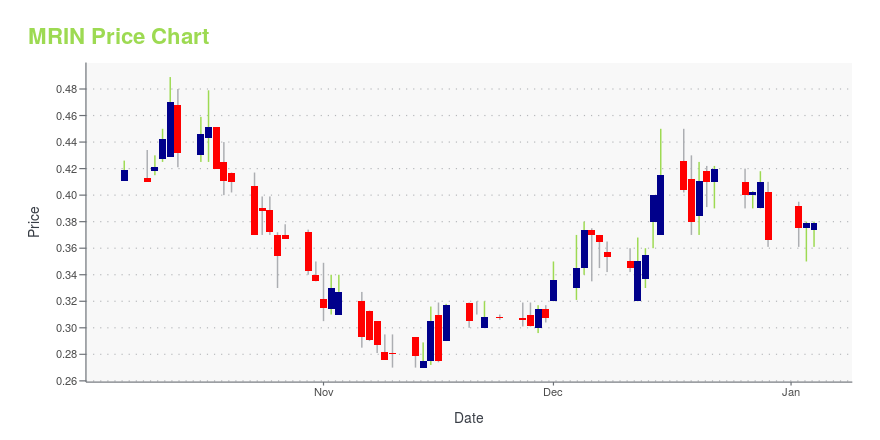
MRIN Stock Price Chart Interactive Chart >
Marin Software Incorporated (MRIN) Company Bio
Marin Software Incorporated operates a cloud-based digital advertising management platform in the United States and internationally. Its platform allows marketing professionals to manage their digital advertising across search, display, and social channels. The company was founded in 2006 and is based in San Francisco, California.
Latest MRIN News From Around the Web
Below are the latest news stories about MARIN SOFTWARE INC that investors may wish to consider to help them evaluate MRIN as an investment opportunity.
Marin Software Launches Support for Qihoo 360, Expanding Options for Advertisers Focused on ChinaSAN FRANCISCO, November 30, 2023--Marin Software, a leading platform for performance marketing, announced its integration with Qihoo 360, the second-largest search engine in China. With this new integration, Marin users can access over 90% of searches in China. |
Today’s Biggest Pre-Market Stock Movers: 10 Top Gainers and Losers on FridayIt's time to start the final day of trading this week with a breakdown of the biggest pre-market stock movers for Friday morning! |
Alumni Ventures Double Leads With Marin’s Budget OptimizationSAN FRANCISCO, November 15, 2023--Alumni Ventures, a leading venture capital firm, was looking to improve the performance and consistency of its lead generation program for acquiring new investors across Facebook and LinkedIn. They used Marin Software’s budget optimization tools to automate the prediction of campaign performance and setting of cross-channel budgets. This resulted in dramatically accelerated paid media campaign performance. |
Marin Software Incorporated (NASDAQ:MRIN) Q3 2023 Earnings Call TranscriptMarin Software Incorporated (NASDAQ:MRIN) Q3 2023 Earnings Call Transcript November 2, 2023 Operator: Greetings, and welcome to the Marin Software Third Quarter 2023 Financial Results Conference Call. At this time, all participants are in a listen-only mode. [Operator Instructions]. As a reminder, this conference is being recorded. I would now like to turn the call […] |
Marin Software Announces Third Quarter 2023 Financial ResultsSAN FRANCISCO, November 02, 2023--Marin Software Incorporated (NASDAQ: MRIN) ("Marin", "Marin Software" or the "Company"), a leading provider of digital marketing software for performance-driven advertisers and agencies, today announced financial results for the third quarter ended September 30, 2023. |
MRIN Price Returns
| 1-mo | 6.61% |
| 3-mo | -3.97% |
| 6-mo | 9.01% |
| 1-year | -38.85% |
| 3-year | -94.12% |
| 5-year | -81.15% |
| YTD | 10.05% |
| 2023 | -63.35% |
| 2022 | -73.05% |
| 2021 | 83.66% |
| 2020 | 46.38% |
| 2019 | -74.01% |
Continue Researching MRIN
Here are a few links from around the web to help you further your research on Marin Software Inc's stock as an investment opportunity:Marin Software Inc (MRIN) Stock Price | Nasdaq
Marin Software Inc (MRIN) Stock Quote, History and News - Yahoo Finance
Marin Software Inc (MRIN) Stock Price and Basic Information | MarketWatch
Loading social stream, please wait...