
Marker Therapeutics, Inc. (MRKR): Price and Financial Metrics
MRKR Price/Volume Stats
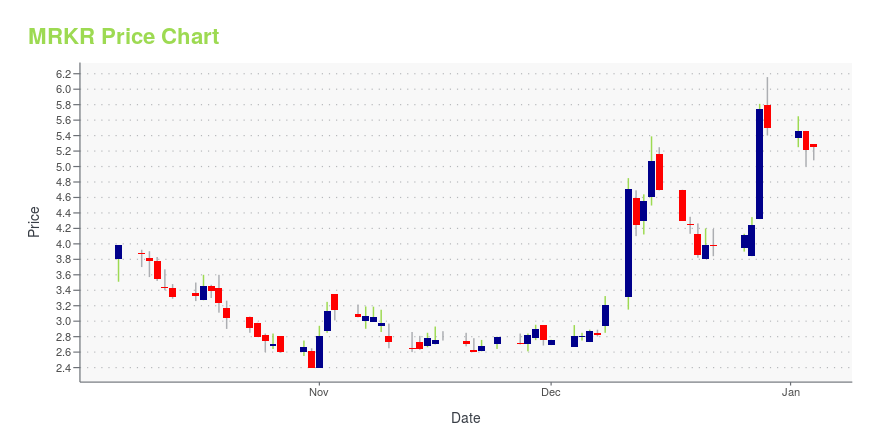
| Current price | $5.45 | 52-week high | $8.85 |
| Prev. close | $5.29 | 52-week low | $2.40 |
| Day low | $5.21 | Volume | 15,691 |
| Day high | $5.51 | Avg. volume | 21,080 |
| 50-day MA | $4.56 | Dividend yield | N/A |
| 200-day MA | $4.11 | Market Cap | 48.61M |
MRKR Stock Price Chart Interactive Chart >
Marker Therapeutics, Inc. (MRKR) Company Bio
Marker Therapeutics, Inc. is a clinical-stage immuno-oncology company specializing in the development of next-generation T cell-based immunotherapies for the treatment of hematological malignancies and solid tumor indications.
Latest MRKR News From Around the Web
Below are the latest news stories about MARKER THERAPEUTICS INC that investors may wish to consider to help them evaluate MRKR as an investment opportunity.
Marker Therapeutics Announces Participation in Biotech Showcase and the 19th Annual Non-Dilutive Funding Summit During “J.P. Morgan Week 2024”HOUSTON, Dec. 21, 2023 (GLOBE NEWSWIRE) -- Marker Therapeutics, Inc. (Nasdaq: MRKR), a clinical-stage immuno-oncology company focusing on developing next-generation T cell-based immunotherapies for the treatment of hematological malignancies and solid tumor indications, announced today that the Company’s management team will participate in Biotech Showcase and present at the 19th Annual Non-Dilutive Funding Summit. Both events will be held in-person and are scheduled alongside the J.P. Morgan 42 |
Marker Therapeutics Announces Sustained Complete Response in First Lymphoma Patient Treated with MT-601 following CAR T RelapseStudy participant with Non-Hodgkin’s Lymphoma who relapsed after anti-CD19 CAR T cell therapy tolerated initial dose level well and remains in complete response six months after MT-601 treatmentHOUSTON, Dec. 11, 2023 (GLOBE NEWSWIRE) -- Marker Therapeutics, Inc. (Nasdaq: MRKR), a clinical-stage immuno-oncology company focusing on developing next-generation T cell-based immunotherapies for the treatment of hematological malignancies and solid tumor indications, today reported a clinical update on |
Marker Therapeutics Reports Third Quarter 2023 Financial Results and Provides Business UpdatesAnnounced complete response in first patient with lymphoma treated with MT-601 in Phase 1 APOLLO trial following CAR T relapse Received Orphan Drug Designation (ODD) from European Medicines Agency (EMA) for multiTAA-specific T cell product candidate MT-401 (zedenoleucel) for the treatment of patients with Acute Myeloid Leukemia (AML) Demonstrated enhanced anti-tumor activity in an aggressive, treatment-resistant AML cell line and provided an update on clinical readiness of the MT-401 Off-the-She |
Marker Therapeutics (NASDAQ:MRKR) Will Have To Spend Its Cash WiselyJust because a business does not make any money, does not mean that the stock will go down. For example, although... |
Marker Therapeutics to Present at the H.C. Wainwright 25th Annual Global Investment ConferenceHOUSTON, Aug. 30, 2023 (GLOBE NEWSWIRE) -- Marker Therapeutics, Inc. (Nasdaq: MRKR), a clinical-stage immuno-oncology company focusing on developing next-generation T cell-based immunotherapies for the treatment of hematological malignancies and solid tumor indications, today announced that Juan F. Vera, M.D., President and Chief Executive Officer, will present at the H.C. Wainwright 25th Annual Global Investment Conference, which is being held on September 11-13, 2023 at the Lotte New York Pala |
MRKR Price Returns
| 1-mo | 14.98% |
| 3-mo | 27.04% |
| 6-mo | 24.15% |
| 1-year | -34.50% |
| 3-year | -74.05% |
| 5-year | -89.85% |
| YTD | -0.91% |
| 2023 | 106.84% |
| 2022 | -72.02% |
| 2021 | -34.47% |
| 2020 | -49.65% |
| 2019 | -48.11% |
Loading social stream, please wait...