Moderna, Inc. (MRNA): Price and Financial Metrics
GET POWR RATINGS... FREE!
MRNA POWR Grades
- MRNA scores best on the Quality dimension, with a Quality rank ahead of 96.48% of US stocks.
- The strongest trend for MRNA is in Value, which has been heading up over the past 179 days.
- MRNA ranks lowest in Stability; there it ranks in the 1st percentile.
MRNA Stock Summary
- MRNA has a higher market value than 96.31% of US stocks; more precisely, its current market capitalization is $72,774,976,191.
- In terms of twelve month growth in earnings before interest and taxes, Moderna Inc is reporting a growth rate of -1,884.39%; that's higher than merely 1.09% of US stocks.
- Revenue growth over the past 12 months for Moderna Inc comes in at 2,199.12%, a number that bests 99.55% of the US stocks we're tracking.
- Stocks that are quantitatively similar to MRNA, based on their financial statements, market capitalization, and price volatility, are VRTX, MU, RACE, LRCX, and KZIA.
- Visit MRNA's SEC page to see the company's official filings. To visit the company's web site, go to www.modernatx.com.
MRNA Valuation Summary
- MRNA's price/sales ratio is 21.7; this is 91.19% higher than that of the median Healthcare stock.
- MRNA's price/sales ratio has moved down 9.8 over the prior 33 months.
- Over the past 33 months, MRNA's price/sales ratio has gone down 9.8.
Below are key valuation metrics over time for MRNA.
Stock | Date | P/S | P/B | P/E | EV/EBIT |
---|---|---|---|---|---|
MRNA | 2021-08-31 | 21.7 | 22.7 | 43.5 | 38.5 |
MRNA | 2021-08-30 | 21.3 | 22.3 | 42.8 | 37.8 |
MRNA | 2021-08-27 | 22.0 | 23.0 | 44.1 | 39.0 |
MRNA | 2021-08-26 | 23.0 | 24.1 | 46.2 | 41.0 |
MRNA | 2021-08-25 | 22.9 | 24.0 | 46.0 | 40.7 |
MRNA | 2021-08-24 | 22.7 | 23.8 | 45.6 | 40.4 |
MRNA's Quality Factors
The “Quality” component of the POWR Ratings focuses on 31 different factors of a companies fundamentals and operational strength. Here are some key insights as we drill into the specifics of these quality attributes.- MRNA has a Quality Grade of A, ranking ahead of 98.11% of graded US stocks.
- MRNA's asset turnover comes in at 0.829 -- ranking 29th of 682 Pharmaceutical Products stocks.
- 500 - Internal server error
The table below shows MRNA's key quality metrics over time.
Period | Asset Turnover | Gross Margin | ROIC |
---|---|---|---|
2021-09-30 | 0.829 | 0.859 | 4.068 |
2021-06-30 | 0.688 | 0.865 | 4.248 |
2021-03-31 | 0.388 | 0.926 | 0.804 |
2020-12-31 | 0.183 | 0.990 | -0.511 |
2020-09-30 | 0.084 | 1.000 | -0.360 |
2020-06-30 | 0.048 | 1.000 | -0.322 |
MRNA Price Target
For more insight on analysts targets of MRNA, see our MRNA price target page. And for a list of of all stocks sorted by upside potential based on analyst target price, see our Top Price Target page.
Average Price Target | $286.15 | Average Broker Recommendation | 1.84 (Hold) |
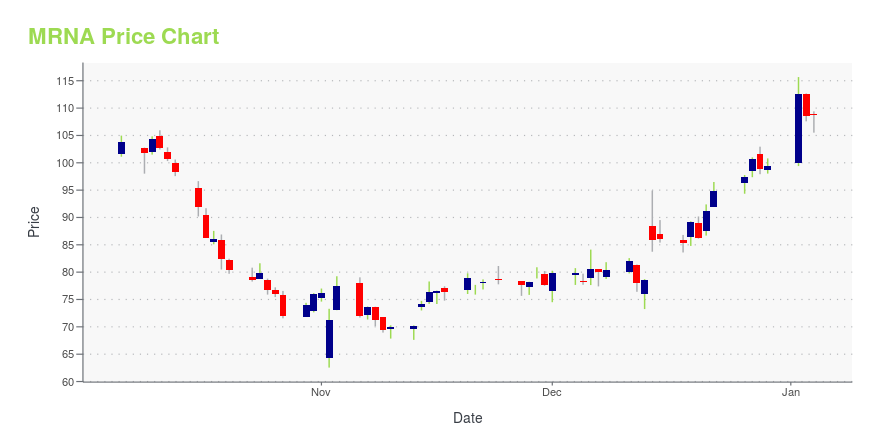
MRNA Stock Price Chart Interactive Chart >
MRNA Price/Volume Stats
Current price | $132.06 | 52-week high | $497.49 |
Prev. close | $137.62 | 52-week low | $119.01 |
Day low | $126.77 | Volume | 6,154,300 |
Day high | $136.60 | Avg. volume | 7,640,626 |
50-day MA | $153.91 | Dividend yield | N/A |
200-day MA | $248.73 | Market Cap | 52.53B |
Moderna, Inc. (MRNA) Company Bio
Moderna, Inc. engages in the development of transformative medicines based on messenger ribonucleic acid (mRNA). Its product pipeline includes the following modalities: prophylactic vaccines, cancer vaccines, intratumoral immuno-oncology, localized regenerative therapeutics, systemic secreted therapeutics, and systemic intracellular therapeutics. The company was founded by Noubar B. Afeyan, Robert S. Langer, Derrick J. Rose, and Kenneth R. Chien in 2010 and is headquartered in Cambridge, MA
Latest MRNA News From Around the Web
Below are the latest news stories about Moderna Inc that investors may wish to consider to help them evaluate MRNA as an investment opportunity.
Moderna Soars 15% on Stellar Q4 ResultsBiotechnology behemoth Moderna Inc. (MRNA) reported stellar fourth quarter and full-year fiscal 2021 results, outpacing both revenue and earnings expectations by a huge margin. Shares soared 15.1% on the news closing at $156.23 on February 24. Moderna’s COVID-19 vaccine, Spikevax, has received full U.S. FDA approval, and its revenue was boosted majorly by Spikevax-related sales. Yet, shares of one of the best coronavirus vaccine stocks, MRNA, lost 33.5% year-to-date vis-à-vis gaining 5.3% over the past year. Additionally, the company’s board of directors announced a new share buyback program of $3 billion. Stellar Results Moderna’s Q4-diluted earnings of $11.29 came in significantly higher than analysts' estimates of $9.90 per share. |
Moderna’s Covid Shot Alone Isn’t Enough to Revitalize a Sagging StockModerna has to focus on the rest of its pipeline to keep MRNA stock relevant and profitable as Covid vaccine revenues taper off by 2023. |
CDC eases COVID mask rules for most U.S. regionsYahoo Finance's Anjalee Khemlani discusses the CDC's new guidelines for COVID-19 mask-wearing. |
10 Companies That Topped Profit ExpectationsIn this article, we will take a look at the 10 companies that topped profit expectations. You can skip our detailed analysis of these companies and go directly to the 5 Companies That Topped Profit Expectations. Notable stocks from the consumer cyclical sector, including Booking Holdings Inc. (NASDAQ:BKNG), eBay Inc. (NASDAQ:EBAY) and Bath & Body […] |
UPDATE 1-EMA panel backs 3 month interval for Moderna boosterThe advisory committee to the European Union's drug regulator on Friday said it has recommended reducing the interval between the second dose and booster dose of Moderna Inc's COVID-19 vaccine from six months to three months. Several countries including Greece and France have previously shortened the interval between the first two doses and the booster dose of COVID-19 vaccines, in the face of rising cases due to the Omicron variant. The European Medicines Agency (EMA) in December said data supported safe and effective administration of a booster as early as three months after a two-shot regimen, without changing the six month recommendation. |
MRNA Price Returns
1-mo | -12.20% |
3-mo | -15.47% |
6-mo | -59.94% |
1-year | -21.98% |
3-year | 504.95% |
5-year | N/A |
YTD | -48.00% |
2021 | 143.11% |
2020 | 434.10% |
2019 | 28.09% |
2018 | N/A |
2017 | N/A |
Loading social stream, please wait...