
Marinus Pharmaceuticals, Inc. (MRNS): Price and Financial Metrics
MRNS Price/Volume Stats
| Current price | $1.43 | 52-week high | $11.26 |
| Prev. close | $1.42 | 52-week low | $1.10 |
| Day low | $1.41 | Volume | 175,692 |
| Day high | $1.47 | Avg. volume | 1,314,470 |
| 50-day MA | $1.38 | Dividend yield | N/A |
| 200-day MA | $6.01 | Market Cap | 78.56M |
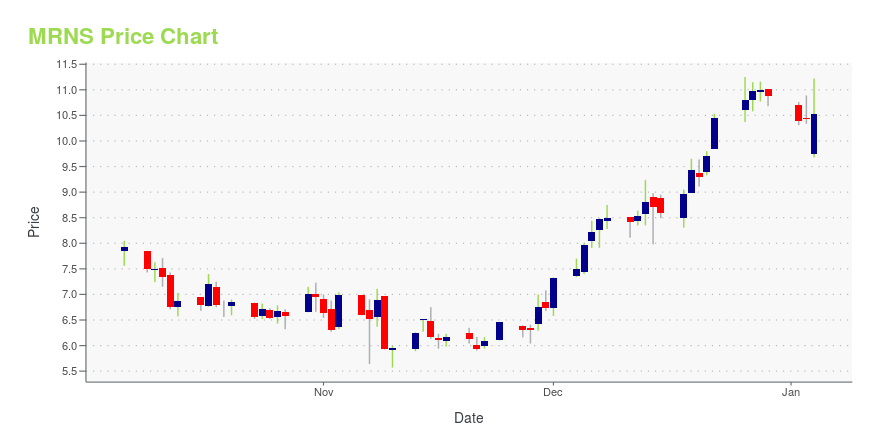
MRNS Stock Price Chart Interactive Chart >
Marinus Pharmaceuticals, Inc. (MRNS) Company Bio
Marinus Pharmaceuticals is a biopharmaceutical company dedicated to the development of innovative neuropsychiatric therapeutics. The company was founded in 2003 and is based in Radnor, Pennsylvania.
Latest MRNS News From Around the Web
Below are the latest news stories about MARINUS PHARMACEUTICALS INC that investors may wish to consider to help them evaluate MRNS as an investment opportunity.
Marinus Pharmaceuticals Announces Inducement Grants Under Nasdaq Listing Rule 5635(C)(4)RADNOR, Pa., December 07, 2023--Marinus Pharmaceuticals, Inc. (Nasdaq: MRNS), a pharmaceutical company dedicated to the development of innovative therapeutics to treat seizure disorders, today announced the grant of inducement awards to four new employees. The Compensation Committee of the Board of Directors of Marinus approved the grant of non-qualified stock options to purchase an aggregate of 74,650 shares of its common stock (the "Common Stock") and the grant of restricted stock units which, |
Marinus Pharmaceuticals Announces Seven Presentations at AES 2023, New Publication in Epilepsia and Results From the Second Generation Formulation MAD StudyRADNOR, Pa., November 20, 2023--Marinus Pharmaceuticals, Inc. (Nasdaq: MRNS), a pharmaceutical company dedicated to the development of innovative therapeutics to treat seizure disorders, today announced the acceptance of seven abstracts for presentation at the upcoming American Epilepsy Society (AES) 2023 Annual Meeting, taking place in Orlando, Florida December 1-5, 2023. Marinus will also host a scientific exhibit showcasing a series of posters highlighting the potential of ganaxolone in the t |
Marinus Pharmaceuticals to Present at the 6th Annual Evercore ISI HealthCONx ConferenceRADNOR, Pa., November 14, 2023--Marinus Pharmaceuticals, Inc. (Nasdaq: MRNS), a pharmaceutical company dedicated to the development of innovative therapeutics to treat seizure disorders, today announced that Scott Braunstein, M.D., Chairman and Chief Executive Officer, will be participating in a fireside chat at the 6th Annual Evercore ISI HealthCONx Conference. |
Marinus Pharmaceuticals, Inc. (NASDAQ:MRNS) Q3 2023 Earnings Call TranscriptMarinus Pharmaceuticals, Inc. (NASDAQ:MRNS) Q3 2023 Earnings Call Transcript November 7, 2023 Marinus Pharmaceuticals, Inc. beats earnings expectations. Reported EPS is $-0.61, expectations were $-0.67. Operator: Greetings and welcome to the Marinus Pharmaceuticals’ Third Quarter 2023 Financial Results and Business Update Call. [Operator Instructions]. And now, it is my pleasure to introduce your host, Sonya […] |
Marinus Pharmaceuticals Inc (MRNS) Reports Q3 2023 Financial ResultsCompany sees strong quarter over quarter growth and robust payer coverage for ZTALMY |
MRNS Price Returns
| 1-mo | 13.49% |
| 3-mo | 1.78% |
| 6-mo | -85.73% |
| 1-year | -85.17% |
| 3-year | -90.55% |
| 5-year | -68.08% |
| YTD | -86.84% |
| 2023 | 173.12% |
| 2022 | -66.50% |
| 2021 | -2.62% |
| 2020 | 41.20% |
| 2019 | -24.74% |
Loading social stream, please wait...