
Merus N.V. (MRUS): Price and Financial Metrics
MRUS Price/Volume Stats
| Current price | $54.19 | 52-week high | $61.61 |
| Prev. close | $54.32 | 52-week low | $19.81 |
| Day low | $53.70 | Volume | 263,700 |
| Day high | $55.69 | Avg. volume | 791,615 |
| 50-day MA | $53.86 | Dividend yield | N/A |
| 200-day MA | $39.59 | Market Cap | 3.18B |
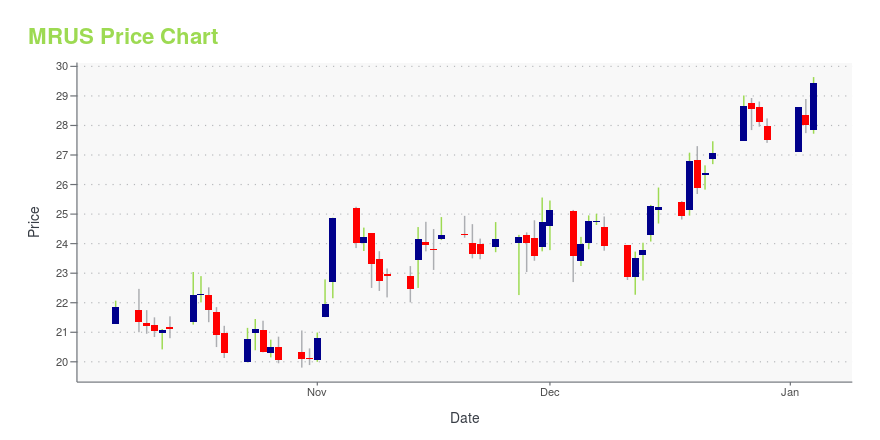
MRUS Stock Price Chart Interactive Chart >
Merus N.V. (MRUS) Company Bio
Merus B.V., a clinical-stage immuno-oncology company, engages in developing bispecific antibody therapeutics. The company was founded in 2003 and is based in Utrecht, Netherlands.
Latest MRUS News From Around the Web
Below are the latest news stories about MERUS NV that investors may wish to consider to help them evaluate MRUS as an investment opportunity.
Wall Street Analysts See a 52.96% Upside in Merus N.V. (MRUS): Can the Stock Really Move This High?The average of price targets set by Wall Street analysts indicates a potential upside of 53% in Merus N.V. (MRUS). While the effectiveness of this highly sought-after metric is questionable, the positive trend in earnings estimate revisions might translate into an upside in the stock. |
Wall Street Analysts Think Merus N.V. (MRUS) Could Surge 87.71%: Read This Before Placing a BetThe mean of analysts' price targets for Merus N.V. (MRUS) points to an 87.7% upside in the stock. While this highly sought-after metric has not proven reasonably effective, strong agreement among analysts in raising earnings estimates does indicate an upside in the stock. |
Merus N.V. (MRUS) Moves to Buy: Rationale Behind the UpgradeMerus N.V. (MRUS) has been upgraded to a Zacks Rank #2 (Buy), reflecting growing optimism about the company's earnings prospects. This might drive the stock higher in the near term. |
Merus Presents Interim Data on MCLA-129 at ESMO Asia Congress 2023MCLA-129 in combination with chemotherapy in 2L+ EGFRm NSCLC planned to initiate 1Q24UTRECHT, The Netherlands and CAMBRIDGE, Mass., Dec. 02, 2023 (GLOBE NEWSWIRE) -- Merus N.V. (Nasdaq: MRUS) (“Merus”, “the Company”, “we”, or “our”), a clinical-stage oncology company developing innovative, full-length multispecific antibodies (Biclonics® and Triclonics®), today announced updated interim clinical data on MCLA-129 from ongoing expansion cohorts in non-small cell lung cancer (NSCLC) and in previous |
Merus Announces Publication of Abstracts on MCLA-129 for Presentation at ESMO Asia Congress 2023- Oral presentation on MCLA-129 in combination with osimertinib as first line therapy, and in previously treated, NSCLC on Sunday, December 3 at 9:40 a.m. SGT - Poster presentation on MCLA-129 in previously treated HNSCC on Saturday, December 2 at 17:50 p.m. SGT - Investor call on Monday, November 27, 2023 8:00 a.m. ET UTRECHT, The Netherlands and CAMBRIDGE, Mass., Nov. 26, 2023 (GLOBE NEWSWIRE) -- Merus N.V. (Nasdaq: MRUS) (Merus, the Company, we, or our), a clinical-stage oncology company deve |
MRUS Price Returns
| 1-mo | -9.98% |
| 3-mo | 20.32% |
| 6-mo | 52.99% |
| 1-year | 112.34% |
| 3-year | 216.90% |
| 5-year | 244.06% |
| YTD | 97.05% |
| 2023 | 77.76% |
| 2022 | -51.35% |
| 2021 | 81.40% |
| 2020 | 24.50% |
| 2019 | 0.57% |
Continue Researching MRUS
Want to see what other sources are saying about Merus NV's financials and stock price? Try the links below:Merus NV (MRUS) Stock Price | Nasdaq
Merus NV (MRUS) Stock Quote, History and News - Yahoo Finance
Merus NV (MRUS) Stock Price and Basic Information | MarketWatch
Loading social stream, please wait...