
MS&AD Insurance Group Holdings Inc. ADR (MSADY): Price and Financial Metrics
MSADY Price/Volume Stats
| Current price | $21.86 | 52-week high | $24.74 |
| Prev. close | $21.85 | 52-week low | $17.78 |
| Day low | $21.43 | Volume | 30,367 |
| Day high | $21.99 | Avg. volume | 84,103 |
| 50-day MA | $22.37 | Dividend yield | 3.89% |
| 200-day MA | $0.00 | Market Cap | 35.16B |
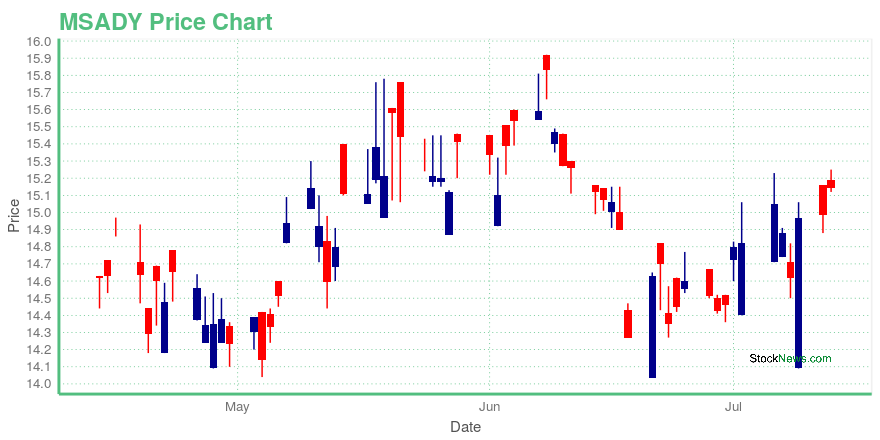
MSADY Stock Price Chart Interactive Chart >
MS&AD Insurance Group Holdings Inc. ADR (MSADY) Company Bio
MS&AD Insurance Group Holdings (MS&ADインシュアランスグループホールディングス株式会社, Emu Esu ando Ei Dī Inshuaransu Gurūpu Horudingusu Kabushiki-gaisha) (TYO: 8725) is a Japanese insurance company. Its businesses include Mitsui Sumitomo Insurance and Aioi Nissay Dowa Insurance. It is listed on the Nikkei 225. (Source:Wikipedia)
MSADY Price Returns
| 1-mo | 0.30% |
| 3-mo | -1.75% |
| 6-mo | 4.64% |
| 1-year | -2.47% |
| 3-year | 119.47% |
| 5-year | 172.37% |
| YTD | 0.41% |
| 2024 | 69.45% |
| 2023 | 24.79% |
| 2022 | 5.31% |
| 2021 | 2.00% |
| 2020 | -4.94% |
MSADY Dividends
| Ex-Dividend Date | Type | Payout Amount | Change | ||||||
|---|---|---|---|---|---|---|---|---|---|
| Loading, please wait... | |||||||||
Loading social stream, please wait...