Midland States Bancorp, Inc. (MSBI): Price and Financial Metrics
MSBI Price/Volume Stats
Current price | $25.13 | 52-week high | $28.47 |
Prev. close | $24.82 | 52-week low | $17.98 |
Day low | $24.82 | Volume | 41,717 |
Day high | $25.23 | Avg. volume | 58,195 |
50-day MA | $24.92 | Dividend yield | 5.11% |
200-day MA | $23.28 | Market Cap | 549.09M |
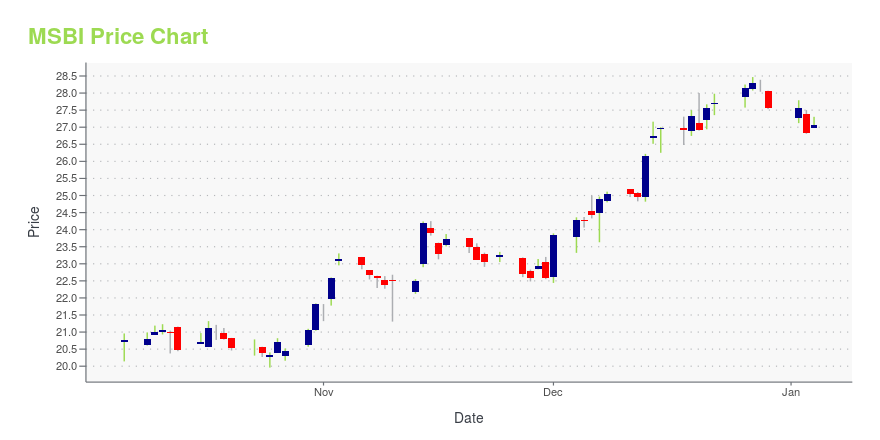
MSBI Stock Price Chart Interactive Chart >
MSBI POWR Grades
- Value is the dimension where MSBI ranks best; there it ranks ahead of 90.49% of US stocks.
- MSBI's strongest trending metric is Growth; it's been moving down over the last 26 weeks.
- MSBI's current lowest rank is in the Growth metric (where it is better than 15.18% of US stocks).
MSBI Stock Summary
- With a price/earnings ratio of 6.85, MIDLAND STATES BANCORP INC P/E ratio is greater than that of about only 9.03% of stocks in our set with positive earnings.
- The ratio of debt to operating expenses for MIDLAND STATES BANCORP INC is higher than it is for about 78.57% of US stocks.
- MSBI's equity multiplier -- a measure of assets relative to shareholders'equity -- is greater than that of 90.59% of US stocks.
- Stocks that are quantitatively similar to MSBI, based on their financial statements, market capitalization, and price volatility, are SFBC, OCFC, SPFI, EQBK, and BHB.
- Visit MSBI's SEC page to see the company's official filings. To visit the company's web site, go to www.midlandsb.com.
MSBI Valuation Summary
- MSBI's EV/EBIT ratio is 8.9; this is 25.52% lower than that of the median Financial Services stock.
- MSBI's EV/EBIT ratio has moved down 3.6 over the prior 92 months.
Below are key valuation metrics over time for MSBI.
Stock | Date | P/S | P/B | P/E | EV/EBIT |
---|---|---|---|---|---|
MSBI | 2023-12-22 | 1.9 | 0.8 | 7.1 | 8.9 |
MSBI | 2023-12-21 | 1.9 | 0.8 | 7.0 | 8.9 |
MSBI | 2023-12-20 | 1.9 | 0.8 | 6.9 | 8.8 |
MSBI | 2023-12-19 | 1.9 | 0.8 | 7.0 | 8.8 |
MSBI | 2023-12-18 | 1.9 | 0.8 | 6.9 | 8.8 |
MSBI | 2023-12-15 | 1.9 | 0.8 | 6.9 | 8.8 |
MSBI Growth Metrics
- Its 3 year cash and equivalents growth rate is now at 20.18%.
- The 5 year revenue growth rate now stands at 30.77%.
- Its year over year revenue growth rate is now at 19.14%.
The table below shows MSBI's growth in key financial areas (numbers in millions of US dollars).
Date | Revenue | Operating Cash Flow | Net Income to Common Stock |
---|---|---|---|
2022-09-30 | 288.012 | 239.417 | 89.26 |
2022-06-30 | 281.859 | 272.262 | 85.287 |
2022-03-31 | 279.335 | 215.14 | 83.528 |
2021-12-31 | 274.181 | 334.438 | 81.317 |
2021-09-30 | 254.464 | 394.38 | 66.543 |
2021-06-30 | 245.67 | 691.808 | 47.081 |
MSBI's Quality Factors
The “Quality” component of the POWR Ratings focuses on 31 different factors of a companies fundamentals and operational strength. Here are some key insights as we drill into the specifics of these quality attributes.- MSBI has a Quality Grade of C, ranking ahead of 45.44% of graded US stocks.
- MSBI's asset turnover comes in at 0.036 -- ranking 258th of 430 Banking stocks.
- WBS, NTRS, and EMCF are the stocks whose asset turnover ratios are most correlated with MSBI.
The table below shows MSBI's key quality metrics over time.
Period | Asset Turnover | Gross Margin | ROIC |
---|---|---|---|
2021-06-30 | 0.036 | 1 | 0.008 |
2021-03-31 | 0.035 | 1 | 0.008 |
2020-12-31 | 0.033 | 1 | 0.005 |
2020-09-30 | 0.035 | 1 | 0.006 |
2020-06-30 | 0.036 | 1 | 0.008 |
2020-03-31 | 0.039 | 1 | 0.009 |
MSBI Price Target
For more insight on analysts targets of MSBI, see our MSBI price target page. And for a list of of all stocks sorted by upside potential based on analyst target price, see our Top Price Target page.
Average Price Target | $28.25 | Average Broker Recommendation | 2 (Hold) |
Midland States Bancorp, Inc. (MSBI) Company Bio
Midland States Bancorp Inc. provides personal and business banking products and services in Illinois and Missouri. The company was founded in 1881 and is based in Effingham, Illinois.
Latest MSBI News From Around the Web
Below are the latest news stories about MIDLAND STATES BANCORP INC that investors may wish to consider to help them evaluate MSBI as an investment opportunity.
Shore Bancshares (SHBI) Soars 7.3%: Is Further Upside Left in the Stock?Shore Bancshares (SHBI) saw its shares surge in the last session with trading volume being higher than average. The latest trend in earnings estimate revisions may not translate into further price increase in the near term. |
Following a 3.7% decline over last year, recent gains may please Midland States Bancorp, Inc. (NASDAQ:MSBI) institutional ownersKey Insights Given the large stake in the stock by institutions, Midland States Bancorp's stock price might be... |
Midland States Bancorp, Inc. Announces Authorization of New $25 Million Stock Repurchase ProgramEFFINGHAM, Ill., Dec. 05, 2023 (GLOBE NEWSWIRE) -- Midland States Bancorp, Inc. (NASDAQ: MSBI) announced today that its Board of Directors has approved a new stock repurchase program that authorizes the Company to repurchase up to $25 million of its common stock. The new stock repurchase program will become effective on January 1, 2024 and expires on December 31, 2024. The Company’s current stock repurchase program expires on December 31, 2023 and has approximately $7.2 million remaining under t |
Should You Buy Midland States Bancorp, Inc. (NASDAQ:MSBI) For Its Upcoming Dividend?Some investors rely on dividends for growing their wealth, and if you're one of those dividend sleuths, you might be... |
Midland States Bancorp, Inc. Announces Common Stock and Preferred Stock DividendsEFFINGHAM, Ill., Nov. 06, 2023 (GLOBE NEWSWIRE) -- Midland States Bancorp, Inc. (NASDAQ: MSBI) announced today that its Board of Directors declared a quarterly cash dividend of $0.30 per share of its common stock. The dividend is payable on November 24, 2023 to all shareholders of record as of the close of business on November 17, 2023. The Board of Directors also declared a cash dividend of $0.4844 per depository share on its 7.75% Fixed-Rate Reset Non-Cumulative Perpetual Preferred Stock, Seri |
MSBI Price Returns
1-mo | 3.84% |
3-mo | -7.65% |
6-mo | 25.49% |
1-year | 20.95% |
3-year | 5.74% |
5-year | 33.13% |
YTD | -7.65% |
2023 | 9.14% |
2022 | 12.00% |
2021 | 45.14% |
2020 | -34.33% |
2019 | 34.57% |
MSBI Dividends
Ex-Dividend Date | Type | Payout Amount | Change | ||||||
---|---|---|---|---|---|---|---|---|---|
Loading, please wait... |
Continue Researching MSBI
Want to see what other sources are saying about Midland States Bancorp Inc's financials and stock price? Try the links below:Midland States Bancorp Inc (MSBI) Stock Price | Nasdaq
Midland States Bancorp Inc (MSBI) Stock Quote, History and News - Yahoo Finance
Midland States Bancorp Inc (MSBI) Stock Price and Basic Information | MarketWatch
Loading social stream, please wait...