MSCI Inc. (MSCI): Price and Financial Metrics

MSCI Inc. (MSCI): $560.45

3.45 (+0.62%)

POWR Rating

Component Grades

Momentum

C

Stability

C

Sentiment

Quality

B

MSCI Price/Volume Stats

Current price $560.45 52-week high $617.39
Prev. close $557.00 52-week low $451.55
Day low $557.52 Volume 338,900
Day high $563.23 Avg. volume 461,072
50-day MA $565.65 Dividend yield 1.16%
200-day MA $530.27 Market Cap 44.40B

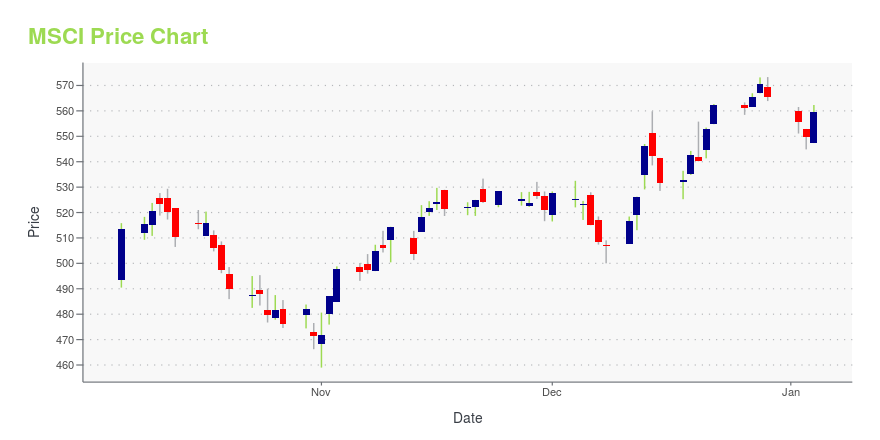
MSCI Stock Price Chart Interactive Chart >

MSCI POWR Grades

  • Quality is the dimension where MSCI ranks best; there it ranks ahead of 94.04% of US stocks.
  • The strongest trend for MSCI is in Stability, which has been heading up over the past 26 weeks.
  • MSCI's current lowest rank is in the Value metric (where it is better than 9% of US stocks).

MSCI Stock Summary

  • MSCI has a higher market value than 93.99% of US stocks; more precisely, its current market capitalization is $43,489,872,645.
  • The capital turnover (annual revenue relative to shareholder's equity) for MSCI is -2.3 -- better than just 4.27% of US stocks.
  • MSCI's equity multiplier -- a measure of assets relative to shareholders'equity -- is greater than that of only 3.7% of US stocks.
  • Stocks with similar financial metrics, market capitalization, and price volatility to MSCI INC are SIRI, DD, HOLX, WAB, and TEL.
  • Visit MSCI's SEC page to see the company's official filings. To visit the company's web site, go to www.msci.com.

MSCI Valuation Summary

  • In comparison to the median Financial Services stock, MSCI's price/earnings ratio is 320.91% higher, now standing at 46.3.
  • MSCI's price/sales ratio has moved up 10.2 over the prior 196 months.

Below are key valuation metrics over time for MSCI.

Stock Date P/S P/B P/E EV/EBIT
MSCI 2023-12-22 18.4 -42.4 46.3 35.6
MSCI 2023-12-21 18.1 -41.7 45.6 35.1
MSCI 2023-12-20 17.7 -40.7 44.5 34.3
MSCI 2023-12-19 17.8 -40.9 44.7 34.5
MSCI 2023-12-18 17.5 -40.2 43.9 33.9
MSCI 2023-12-15 17.4 -40.1 43.8 33.8

MSCI Growth Metrics

    Its year over year cash and equivalents growth rate is now at -61.12%.
  • Its 5 year cash and equivalents growth rate is now at 53.07%.
  • Its year over year revenue growth rate is now at 20.95%.
Over the past 34 months, MSCI's revenue has gone up $645,403,000.

The table below shows MSCI's growth in key financial areas (numbers in millions of US dollars).

Date Revenue Operating Cash Flow Net Income to Common Stock
2022-12-31 2,248.598 1,095.369 870.573
2022-09-30 2,222.232 1,059.606 849.467
2022-06-30 2,178.692 952.428 802.751
2022-03-31 2,125.066 964.796 757.587
2021-12-31 2,043.544 936.069 725.983
2021-09-30 1,937.363 892.333 688.334

MSCI's Quality Factors

The “Quality” component of the POWR Ratings focuses on 31 different factors of a companies fundamentals and operational strength. Here are some key insights as we drill into the specifics of these quality attributes.
  • MSCI has a Quality Grade of B, ranking ahead of 85.03% of graded US stocks.
  • MSCI's asset turnover comes in at 0.414 -- ranking 362nd of 561 Business Services stocks.
  • VMW, RAMP, and SREV are the stocks whose asset turnover ratios are most correlated with MSCI.

The table below shows MSCI's key quality metrics over time.

Period Asset Turnover Gross Margin ROIC
2021-09-30 0.414 0.825 0.245
2021-06-30 0.418 0.827 0.251
2021-03-31 0.412 0.828 0.245
2020-12-31 0.413 0.828 0.232
2020-09-30 0.404 0.828 0.225
2020-06-30 0.412 0.824 0.234

MSCI Inc. (MSCI) Company Bio


MSCI Inc. is an American finance company headquartered in New York City. MSCI is a global provider of equityfixed income, real estate indexes, multi-asset portfolio analysis tools, ESG and climate products. It operates the MSCI World, MSCI All Country World Index (ACWI), MSCI Emerging Markets Indexes. (Source:Wikipedia)


MSCI Latest News Stream


Event/Time News Detail
Loading, please wait...

MSCI Latest Social Stream


Loading social stream, please wait...

View Full MSCI Social Stream

Latest MSCI News From Around the Web

Below are the latest news stories about MSCI INC that investors may wish to consider to help them evaluate MSCI as an investment opportunity.

Is iShares ESG Aware MSCI USA ETF (ESGU) a Strong ETF Right Now?

Smart Beta ETF report for ESGU

Yahoo | December 28, 2023

EMERGING MARKETS-Latam stocks, FX index hover around multiyear highs as rate-cut bets persist

* Chilean peso climbs on higher copper prices * Latam FX index hits highest level since 2011; stock index at 2022 highs * Bovespa touches fresh intraday high * Latam stocks up 0.3%, FX up 0.2% (Updated at 3pm ET/2000 GMT) By Siddarth S and Lisa Pauline Mattackal Dec 27 (Reuters) - Latin American currencies and stocks were steady on Wednesday, with indexes of both markets hovering around multiyear highs as bets on U.S. rate cuts pressured the U.S. dollar, while positive China data further boosted commodity-heavy regional markets. A basket of regional currencies rose 0.2%, briefly touching its highest level since 2011 as the U.S. dollar traded around five-month lows. The MSCI index tracking Latin American stocks jumped 0.2%, trading around its highest level since April 2022,...

Yahoo | December 27, 2023

Is SPDR MSCI USA StrategicFactors ETF (QUS) a Strong ETF Right Now?

Smart Beta ETF report for QUS

Yahoo | December 27, 2023

Analyst Favorites: 3 Newly Rated ‘Buy’ Stocks to Consider Now

The top analyst stock picks heading into 2024 include these three names that analysts have recently initiated coverage with a "Buy".

Will Ashworth on InvestorPlace | December 26, 2023

Is iShares MSCI USA Quality Factor ETF (QUAL) a Strong ETF Right Now?

Smart Beta ETF report for QUAL

Yahoo | December 22, 2023

Read More 'MSCI' Stories Here

MSCI Price Returns

1-mo -1.31%
3-mo -0.64%
6-mo 9.84%
1-year 3.27%
3-year 38.07%
5-year 195.31%
YTD -0.64%
2023 22.90%
2022 -23.34%
2021 38.14%
2020 74.38%
2019 77.19%

MSCI Dividends

Ex-Dividend Date Type Payout Amount Change
Loading, please wait...
View Full MSCI Dividend History

Get Free Updates

Join thousands of investors who get the latest news, insights and top rated picks from StockNews.com!