MSCI Inc. (MSCI): Price and Financial Metrics
GET POWR RATINGS... FREE!
MSCI POWR Grades
- Quality is the dimension where MSCI ranks best; there it ranks ahead of 92.7% of US stocks.
- MSCI's strongest trending metric is Stability; it's been moving down over the last 179 days.
- MSCI ranks lowest in Value; there it ranks in the 8th percentile.
MSCI Stock Summary
- MSCI Inc's market capitalization of $41,996,965,130 is ahead of 93.31% of US-listed equities.
- MSCI Inc's capital turnover -- a measure of revenue relative to shareholder's equity -- is better than merely 1.28% of US listed stocks.
- MSCI's equity multiplier -- a measure of assets relative to shareholders'equity -- is greater than that of only 1.44% of US stocks.
- Stocks with similar financial metrics, market capitalization, and price volatility to MSCI Inc are MTCH, SIRI, WST, JAZZ, and RMD.
- Visit MSCI's SEC page to see the company's official filings. To visit the company's web site, go to www.msci.com.
MSCI Valuation Summary
- In comparison to the median Financial Services stock, MSCI's price/earnings ratio is 561.82% higher, now standing at 72.8.
- MSCI's price/earnings ratio has moved up 37 over the prior 168 months.
- MSCI's price/sales ratio has moved up 19.4 over the prior 168 months.
Below are key valuation metrics over time for MSCI.
Stock | Date | P/S | P/B | P/E | EV/EBIT |
---|---|---|---|---|---|
MSCI | 2019-09-13 | 13.2 | -83.9 | 33.5 | 28.0 |
MSCI | 2016-08-31 | 7.7 | 15.9 | 34.0 | 21.0 |
MSCI | 2013-08-08 | 4.6 | 2.9 | 20.5 | 13.8 |
MSCI | 2012-09-07 | 4.9 | 3.2 | 25.4 | 15.2 |
MSCI | 2010-09-23 | 8.4 | 6.9 | 40.9 | 21.9 |
MSCI | 2008-10-20 | 5.2 | 7.0 | 23.6 | 14.5 |
MSCI Growth Metrics
- Its 3 year price growth rate is now at 198.83%.
- Its 2 year price growth rate is now at 120.01%.
- Its 2 year revenue growth rate is now at 21.06%.

The table below shows MSCI's growth in key financial areas (numbers in millions of US dollars).
Date | Revenue | Operating Cash Flow | Net Income to Common Stock |
---|---|---|---|
2021-12-31 | 2,043.544 | 936.069 | 725.983 |
2021-09-30 | 1,937.363 | 892.333 | 688.334 |
2021-06-30 | 1,845.597 | 876.237 | 700.816 |
2021-03-31 | 1,757.033 | 913.796 | 650.516 |
2020-12-31 | 1,695.39 | 811.109 | 601.822 |
2020-09-30 | 1,658.335 | 818.824 | 568.389 |
MSCI's Quality Factors
The “Quality” component of the POWR Ratings focuses on 31 different factors of a companies fundamentals and operational strength. Here are some key insights as we drill into the specifics of these quality attributes.- MSCI has a Quality Grade of B, ranking ahead of 85.03% of graded US stocks.
- MSCI's asset turnover comes in at 0.414 -- ranking 362nd of 561 Business Services stocks.
- VMW, RAMP, and SREV are the stocks whose asset turnover ratios are most correlated with MSCI.
The table below shows MSCI's key quality metrics over time.
Period | Asset Turnover | Gross Margin | ROIC |
---|---|---|---|
2021-09-30 | 0.414 | 0.825 | 0.245 |
2021-06-30 | 0.418 | 0.827 | 0.251 |
2021-03-31 | 0.412 | 0.828 | 0.245 |
2020-12-31 | 0.413 | 0.828 | 0.232 |
2020-09-30 | 0.404 | 0.828 | 0.225 |
2020-06-30 | 0.412 | 0.824 | 0.234 |
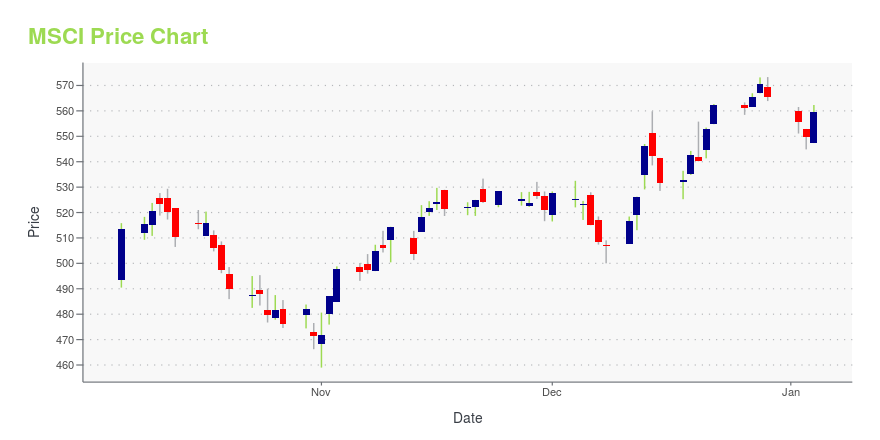
MSCI Stock Price Chart Interactive Chart >
MSCI Price/Volume Stats
Current price | $414.36 | 52-week high | $679.85 |
Prev. close | $414.61 | 52-week low | $376.41 |
Day low | $410.02 | Volume | 121,227 |
Day high | $418.61 | Avg. volume | 636,962 |
50-day MA | $459.18 | Dividend yield | 1% |
200-day MA | $560.39 | Market Cap | 33.67B |
MSCI Inc. (MSCI) Company Bio
MSCI Inc. is an American finance company headquartered in New York City. MSCI is a global provider of equity, fixed income, real estate indexes, multi-asset portfolio analysis tools, ESG and climate products. It operates the MSCI World, MSCI All Country World Index (ACWI), MSCI Emerging Markets Indexes. (Source:Wikipedia)
Latest MSCI News From Around the Web
Below are the latest news stories about MSCI Inc that investors may wish to consider to help them evaluate MSCI as an investment opportunity.
CNBC''s Final Trades: iShares MSCI UK, Illumina, US Silica And This Company That Has An Attractive Buyout DealOn CNBC’s “ Halftime Report Final Trades ,” Liz Young of BNY Mellon Investment Management chose iShares MSCI United Kingdom ETF (NYSEARCA: EWU), saying that the opportunities in Europe were “insulated from Fed rate hikes, and you get a nice dividend yield while you’re in.” Amy Raskin of Chevy Chase Trust said Illumina, Inc. (NASDAQ: … Full story available on Benzinga.com |
MSCI says it won't make previously flagged changes to Russian securities due to sanctionsMSCI will not implement changes for Russian securities that it had previously announced as part of its February review, following U.S. sanctions targeting Russia, the index provider said in a statement on Thursday. MSCI also said it welcomed feedback from market participants on the impact of the U.S. sanctions on their investment processes, including whether any additional changes to MSCI indexes may be necessary or helpful "to maintain the investability of relevant MSCI indexes". The changes, which were announced earlier this month, as part of MSCI's regular review process, had been due to be implemented as of the market's close on Feb. 28. |
Listen In: Who''s going to benefit from the crude oil rally?Asian shares rose Friday after US stocks recovered toward the end of a wild trading day, as the world, including President Joe Biden, slapped sanctions against Russia for its invasion of Ukraine. MSCI''s index of Asia-Pacific shares outside Japan was up by 0.82 per cent. |
Asian shares track Wall Street rally; markets eye long-term Ukraine riskMSCI#39;s broadest index of Asia-Pacific shares outside Japan rose 0.68%, while Japan#39;s Nikkei was trading up 1.53% and Hong Kong#39;s Hang Seng index added 0.16%. Australian shares added 0.3%, driven by a rebound in tech stocks. |
SGX Nifty up 220 points; here''s what changed for market while you were sleepingAsian shares rose Friday after US stocks recovered toward the end of a wild trading day, as the world, including President Joe Biden, slapped sanctions against Russia for its invasion of Ukraine. MSCI''s index of Asia-Pacific shares outside Japan was up by 0.82 per cent. |
MSCI Price Returns
1-mo | -10.13% |
3-mo | -18.29% |
6-mo | -32.97% |
1-year | -10.11% |
3-year | 94.20% |
5-year | 333.47% |
YTD | -32.06% |
2021 | 38.14% |
2020 | 74.38% |
2019 | 77.19% |
2018 | 17.95% |
2017 | 62.63% |
MSCI Dividends
Ex-Dividend Date | Type | Payout Amount | Change | ||||||
---|---|---|---|---|---|---|---|---|---|
Loading, please wait... |
Continue Researching MSCI
Want to do more research on MSCI Inc's stock and its price? Try the links below:MSCI Inc (MSCI) Stock Price | Nasdaq
MSCI Inc (MSCI) Stock Quote, History and News - Yahoo Finance
MSCI Inc (MSCI) Stock Price and Basic Information | MarketWatch
Loading social stream, please wait...