
Emerson Radio Corporation (MSN): Price and Financial Metrics
MSN Price/Volume Stats
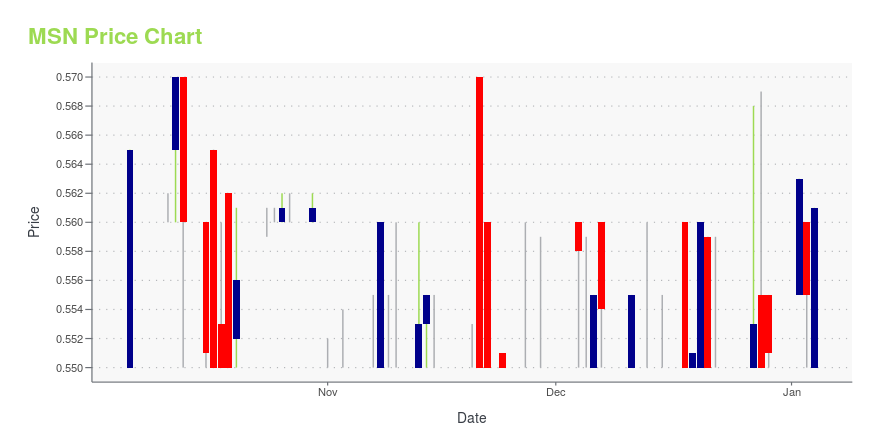
| Current price | $0.51 | 52-week high | $0.83 |
| Prev. close | $0.48 | 52-week low | $0.36 |
| Day low | $0.48 | Volume | 35,800 |
| Day high | $0.54 | Avg. volume | 18,450 |
| 50-day MA | $0.53 | Dividend yield | N/A |
| 200-day MA | $0.54 | Market Cap | 10.73M |
MSN Stock Price Chart Interactive Chart >
Emerson Radio Corporation (MSN) Company Bio
Emerson Radio Corp. designs, markets, and licenses televisions, other video products, microwave ovens, clocks, radios, and audio and home theater products. The Company also, through its partially-owned subsidiary, is a direct marketer of sports-related equipment and leisure products to the institutional market, including schools, military facilities, and athletic teams.
Latest MSN News From Around the Web
Below are the latest news stories about EMERSON RADIO CORP that investors may wish to consider to help them evaluate MSN as an investment opportunity.
Bain Capital Leads Masan Group's Equity Funding Round of Up to US$500 MillionMasan Group Corporation (HOSE: MSN, "Masan" or the "Company") today announced that Bain Capital, a leading private investment firm with approximately US$180 billion of assets under management, has agreed to invest into Masan Group at least US$200 million in equity capital at price of VND85,000 per share (the "Transaction"). Proceeds from the Transaction will be used to strengthen the Company's financial position and de-lever its balance sheet. This marks Bain Capital's first-ever investment in V |
MSN Price Returns
| 1-mo | 0.00% |
| 3-mo | -7.00% |
| 6-mo | -7.27% |
| 1-year | -8.27% |
| 3-year | -60.47% |
| 5-year | -50.96% |
| YTD | -7.41% |
| 2023 | 3.89% |
| 2022 | -34.55% |
| 2021 | -19.39% |
| 2020 | 22.56% |
| 2019 | -43.06% |
Continue Researching MSN
Want to see what other sources are saying about Emerson Radio Corp's financials and stock price? Try the links below:Emerson Radio Corp (MSN) Stock Price | Nasdaq
Emerson Radio Corp (MSN) Stock Quote, History and News - Yahoo Finance
Emerson Radio Corp (MSN) Stock Price and Basic Information | MarketWatch
Loading social stream, please wait...