MicroStrategy Incorporated - (MSTR): Price and Financial Metrics
MSTR Price/Volume Stats
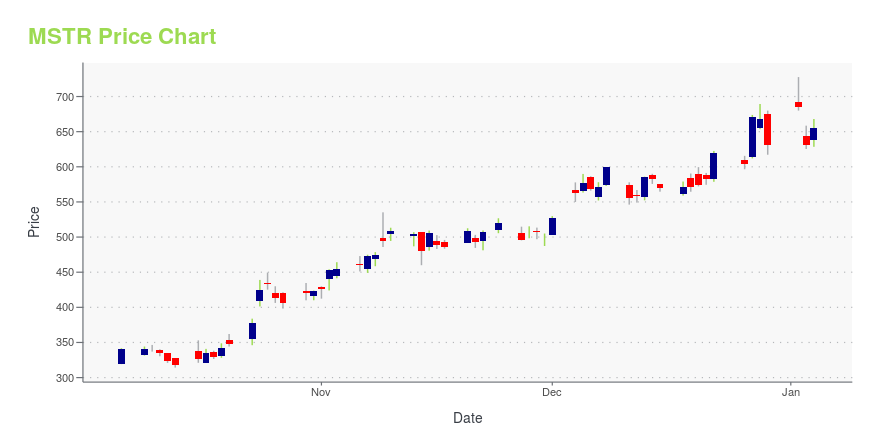
Current price | $566.34 | 52-week high | $589.90 |
Prev. close | $568.89 | 52-week low | $132.56 |
Day low | $552.10 | Volume | 473,529 |
Day high | $578.06 | Avg. volume | 787,919 |
50-day MA | $431.40 | Dividend yield | N/A |
200-day MA | $350.83 | Market Cap | 8.22B |
MSTR Stock Price Chart Interactive Chart >
MSTR POWR Grades
- Growth is the dimension where MSTR ranks best; there it ranks ahead of 57.87% of US stocks.
- MSTR's strongest trending metric is Stability; it's been moving up over the last 177 days.
- MSTR's current lowest rank is in the Value metric (where it is better than 4.2% of US stocks).
MSTR Stock Summary
- MSTR's current price/earnings ratio is 84.81, which is higher than 92.67% of US stocks with positive earnings.
- MSTR's price/sales ratio is 15.19; that's higher than the P/S ratio of 93.14% of US stocks.
- Equity multiplier, or assets relative to shareholders' equity, comes in at 7.08 for MICROSTRATEGY INC; that's greater than it is for 83.96% of US stocks.
- If you're looking for stocks that are quantitatively similar to MICROSTRATEGY INC, a group of peers worth examining would be FA, AGS, EBS, RCAT, and ST.
- MSTR's SEC filings can be seen here. And to visit MICROSTRATEGY INC's official web site, go to www.microstrategy.com.
MSTR Valuation Summary
- MSTR's price/earnings ratio is 81.3; this is 215.12% higher than that of the median Technology stock.
- Over the past 243 months, MSTR's price/earnings ratio has gone up 130.1.
Below are key valuation metrics over time for MSTR.
Stock | Date | P/S | P/B | P/E | EV/EBIT |
---|---|---|---|---|---|
MSTR | 2023-11-28 | 14.6 | 8.7 | 81.3 | -42.1 |
MSTR | 2023-11-27 | 14.3 | 8.6 | 79.6 | -41.5 |
MSTR | 2023-11-24 | 15.0 | 9.0 | 83.6 | -43.0 |
MSTR | 2023-11-22 | 14.6 | 8.8 | 81.6 | -42.3 |
MSTR | 2023-11-21 | 14.2 | 8.5 | 79.2 | -41.3 |
MSTR | 2023-11-20 | 14.6 | 8.8 | 81.7 | -42.3 |
MSTR Growth Metrics
- Its 4 year revenue growth rate is now at -6.1%.
- Its 2 year price growth rate is now at 166.51%.
- Its 3 year net income to common stockholders growth rate is now at -4404.37%.

The table below shows MSTR's growth in key financial areas (numbers in millions of US dollars).
Date | Revenue | Operating Cash Flow | Net Income to Common Stock |
---|---|---|---|
2022-12-31 | 499.264 | 3.211 | -1,469.797 |
2022-09-30 | 501.225 | 24.656 | -1,310.105 |
2022-06-30 | 503.859 | 40.021 | -1,319.162 |
2022-03-31 | 507.137 | 74.812 | -556.211 |
2021-12-31 | 510.762 | 93.833 | -535.48 |
2021-09-30 | 507.566 | 115.908 | -442.842 |
MSTR's Quality Factors
The “Quality” component of the POWR Ratings focuses on 31 different factors of a companies fundamentals and operational strength. Here are some key insights as we drill into the specifics of these quality attributes.- MSTR has a Quality Grade of F, ranking ahead of 4.81% of graded US stocks.
- MSTR's asset turnover comes in at 0.213 -- ranking 478th of 561 Business Services stocks.
- AL, MIGI, and PRAA are the stocks whose asset turnover ratios are most correlated with MSTR.
The table below shows MSTR's key quality metrics over time.
Period | Asset Turnover | Gross Margin | ROIC |
---|---|---|---|
2021-09-30 | 0.213 | 0.825 | -0.174 |
2021-06-30 | 0.278 | 0.826 | -0.235 |
2021-03-31 | 0.357 | 0.819 | -0.129 |
2020-12-31 | 0.490 | 0.811 | -0.029 |
2020-09-30 | 0.573 | 0.803 | -0.018 |
2020-06-30 | 0.545 | 0.796 | 0.086 |
MSTR Price Target
For more insight on analysts targets of MSTR, see our MSTR price target page. And for a list of of all stocks sorted by upside potential based on analyst target price, see our Top Price Target page.
Average Price Target | $810.00 | Average Broker Recommendation | 1.25 (Strong Buy) |
MicroStrategy Incorporated - (MSTR) Company Bio
MicroStrategy designs, develops, markets, and sells enterprise-ready analytics, mobile, and security software platforms worldwide. The company was founded in 1989 and is based in Tysons Corner, Virginia.
Latest MSTR News From Around the Web
Below are the latest news stories about MICROSTRATEGY INC that investors may wish to consider to help them evaluate MSTR as an investment opportunity.
Bitcoin Is Soaring, and These 2 Crypto Stocks Look Red-HotNovember was an amazing month for the stock market, which managed to claw back its losses from the previous couple of months. Over the weekend, Bitcoin climbed to its best levels in more than a year and a half, briefly moving above $42,000. Below, we'll look at why Coinbase Global (NASDAQ: COIN) and MicroStrategy (NASDAQ: MSTR) made big moves higher in premarket trading on Monday morning. |
UPDATE 7-Bitcoin rises above $42,000 for first time since April 2022Bitcoin rose on Monday, briefly surpassing $42,000 to reach a 20-month high, in a new surge of momentum fueled by U.S. interest rate cut expectations and traders betting that American regulators will soon approve exchange-traded spot bitcoin funds. Bitcoin's gains lifted the shares of cryptocurrency-related companies, as well as exchange-traded funds (ETFs) listed in the United States. Coinbase jumped 7% and Microstrategy gained 6.3%, while bitcoin miners such as Riot Platforms , Marathon Digital and CleanSpark rose between 7% and 13%. |
MicroStrategy Bought Another $5.9M Worth of BTC, Bringing Total Holdings to $6.6BTech company MicroStrategy has expanded its Bitcoin (BTC) holdings to a total of 174,530 BTC, valued at about $6.65 billion. |
MicroStrategy Files For $750M Stock Offer After Buying 16.1K BTCMicroStrategy topped up its Bitcoin holdings to over 174,530 BTC on Thursday. |
MicroStrategy’s Saylor Makes Biggest Bitcoin Purchase In More Than 2 Years(Bloomberg) -- MicroStrategy Inc. chairman and co-founder Michael Saylor placed one of his biggest bets yet, with the enterprise-software maker turned Bitcoin investment-fund proxy purchasing $593.3 million more of the largest cryptocurrency. Most Read from BloombergBanking Escapees Make Billions From Private Credit BoomTesla’s Cheapest Cybertruck Will Cost $60,990 and Be Available in 2025These Are the World's Most Expensive Cities to Live In Right NowSaudi Arabia Offers Iran Investment to Blunt |
MSTR Price Returns
1-mo | 19.59% |
3-mo | 58.96% |
6-mo | 100.60% |
1-year | 192.70% |
3-year | 68.44% |
5-year | 343.91% |
YTD | 300.04% |
2022 | -74.00% |
2021 | 40.13% |
2020 | 172.42% |
2019 | 11.65% |
2018 | -2.70% |
Continue Researching MSTR
Want to do more research on MICROSTRATEGY Inc's stock and its price? Try the links below:MICROSTRATEGY Inc (MSTR) Stock Price | Nasdaq
MICROSTRATEGY Inc (MSTR) Stock Quote, History and News - Yahoo Finance
MICROSTRATEGY Inc (MSTR) Stock Price and Basic Information | MarketWatch
Loading social stream, please wait...