
MMTec, Inc. (MTC): Price and Financial Metrics
MTC Price/Volume Stats
| Current price | $0.32 | 52-week high | $12.90 |
| Prev. close | $0.33 | 52-week low | $0.31 |
| Day low | $0.32 | Volume | 1,392,500 |
| Day high | $0.34 | Avg. volume | 3,772,971 |
| 50-day MA | $0.80 | Dividend yield | N/A |
| 200-day MA | $1.46 | Market Cap | 27.31M |
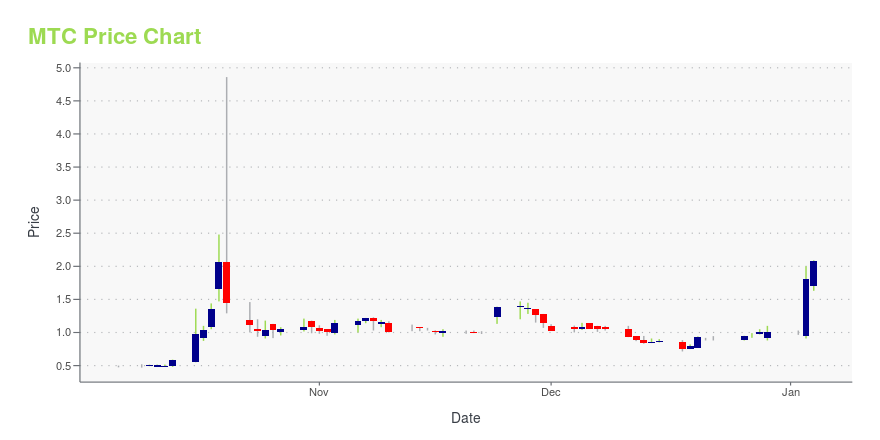
MTC Stock Price Chart Interactive Chart >
MMTec, Inc. (MTC) Company Bio
MMTec, Inc. engages in the provision of internet-based technology services and solutions to the Chinese language speaking hedge and mutual funds, registered investment advisors, proprietary trading groups, and brokerage firms involving in securities market transactions and settlements. Its platforms include ETN Counter Business System, the PTN Private Fund Investment Management System, the Personal Mobile Transaction Client System, the PC Transaction Client System, the Individual and Institutional Integrated Account Management System, and the Quantitative Investment Transaction Platform. The company was founded in June 2015 and is headquartered in Beijing, China.
Latest MTC News From Around the Web
Below are the latest news stories about MMTEC INC that investors may wish to consider to help them evaluate MTC as an investment opportunity.
MMTEC, Inc. Announces Half Year 2023 Unaudited Financial ResultsFirst Half Year of 2023 Financial Highlights |
12 Best Day Trading Stocks To BuyIn this article, we discuss the 12 best day trading stocks to buy. If you want to read about some more day trading stocks, go directly to 5 Best Day Trading Stocks To Buy. Over the past few years, the rise of a new generation of stock traders that like to engage in risky bets, […] |
MMTEC, Inc. Regains Compliance with Nasdaq Minimum Bid Price DeficiencyMMTEC, Inc. (NASDAQ: MTC) ("MMTEC", "we", "our" or the "Company"), a China-based technology company that provides access to the U.S. financial markets, today announced that the Company received a notification letter (the "Notification Letter") from the Listings Qualifications Department of The Nasdaq Stock Market LLC ("Nasdaq") notifying the Company that it has regained compliance with the Nasdaq's minimum bid price requirement and that the matter is closed. |
Shareholders Will Probably Not Have Any Issues With MMTec, Inc.'s (NASDAQ:MTC) CEO CompensationKey Insights MMTec to hold its Annual General Meeting on 10th of November Total pay for CEO Xiangdong Wen includes... |
MMTEC, INC. TO HOLD ITS 2023 ANNUAL MEETING OF SHAREHOLDERS ON NOVEMBER 10, 2023MMTEC, Inc. (NASDAQ: MTC) ("MMTEC", "we", "our" or the "Company"), a China-based technology company that provides access to the U.S. financial markets, today announced that it will hold its 2023 annual meeting of shareholders (the "2023 Annual Meeting") at its principal executive offices at Room 2302, 23rd Floor, FWD Financial Center, 308 Des Voeux Road Central, Sheung Wan, Hong Kong, on November 10, 2023, at 9:00 a.m. local China time (or 8:00 p.m. Eastern Standard Time). The Company's board of |
MTC Price Returns
| 1-mo | -24.35% |
| 3-mo | -88.89% |
| 6-mo | -83.14% |
| 1-year | -59.08% |
| 3-year | -98.10% |
| 5-year | -99.78% |
| YTD | -68.00% |
| 2023 | 29.03% |
| 2022 | -88.26% |
| 2021 | -55.10% |
| 2020 | -24.62% |
| 2019 | N/A |
Loading social stream, please wait...