MACOM Technology Solutions Holdings, Inc. (MTSI): Price and Financial Metrics


MACOM Technology Solutions Holdings, Inc. (MTSI): $69.47

1.73 (+2.55%)

POWR Rating

Component Grades

Growth

S

Value

I

Momentum

G

Stability

N

Sentiment

U

Quality

P

MTSI POWR Grades

  • MTSI scores best on the Momentum dimension, with a Momentum rank ahead of 83.37% of US stocks.
  • MTSI's strongest trending metric is Quality; it's been moving down over the last 177 days.
  • MTSI's current lowest rank is in the Sentiment metric (where it is better than 29.14% of US stocks).

MTSI Stock Summary

  • Price to trailing twelve month operating cash flow for MTSI is currently 27.39, higher than 82.4% of US stocks with positive operating cash flow.
  • Of note is the ratio of MACOM TECHNOLOGY SOLUTIONS HOLDINGS INC's sales and general administrative expense to its total operating expenses; just 23.13% of US stocks have a lower such ratio.
  • With a price/sales ratio of 7.13, MACOM TECHNOLOGY SOLUTIONS HOLDINGS INC has a higher such ratio than 84.74% of stocks in our set.
  • If you're looking for stocks that are quantitatively similar to MACOM TECHNOLOGY SOLUTIONS HOLDINGS INC, a group of peers worth examining would be GNTX, AIP, MIRM, API, and VYNE.
  • MTSI's SEC filings can be seen here. And to visit MACOM TECHNOLOGY SOLUTIONS HOLDINGS INC's official web site, go to www.macom.com.

MTSI Valuation Summary

  • In comparison to the median Technology stock, MTSI's price/earnings ratio is 35.02% lower, now standing at 15.4.
  • Over the past 134 months, MTSI's price/sales ratio has gone up 4.3.

Below are key valuation metrics over time for MTSI.

Stock Date P/S P/B P/E EV/EBIT
MTSI 2023-03-21 7.3 5.9 15.4 38.6
MTSI 2023-03-20 7.2 5.8 15.2 38.3
MTSI 2023-03-17 7.0 5.6 14.7 37.2
MTSI 2023-03-16 7.2 5.8 15.0 37.9
MTSI 2023-03-15 7.0 5.6 14.7 37.0
MTSI 2023-03-14 7.2 5.8 15.1 38.1

MTSI Growth Metrics

    Its 3 year cash and equivalents growth rate is now at 37.66%.
  • The 4 year revenue growth rate now stands at -26.35%.
  • Its year over year net cashflow from operations growth rate is now at -5.19%.
Over the past 70 months, MTSI's revenue has gone up $62,832,000.

The table below shows MTSI's growth in key financial areas (numbers in millions of US dollars).

Date Revenue Operating Cash Flow Net Income to Common Stock
2022-12-31 695.653 181.151 330.647
2022-09-30 675.17 176.982 439.955
2022-06-30 652.237 157.799 217.748
2022-03-31 632.6 162.288 200.519
2021-12-31 618.036 147.736 185.768
2021-09-30 606.92 148.412 37.973

MTSI's Quality Factors

The “Quality” component of the POWR Ratings focuses on 31 different factors of a companies fundamentals and operational strength. Here are some key insights as we drill into the specifics of these quality attributes.
  • MTSI has a Quality Grade of B, ranking ahead of 81.6% of graded US stocks.
  • MTSI's asset turnover comes in at 0.536 -- ranking 133rd of 208 Electronic Equipment stocks.
  • DQ, TDY, and RESN are the stocks whose asset turnover ratios are most correlated with MTSI.

The table below shows MTSI's key quality metrics over time.

Period Asset Turnover Gross Margin ROIC
2021-07-02 0.536 0.550 0.057
2021-04-02 0.520 0.536 0.021
2021-01-01 0.494 0.522 0.001
2020-10-02 0.470 0.510 -0.012
2020-07-03 0.443 0.496 -0.050
2020-04-03 0.418 0.447 -0.316

MTSI Price Target

For more insight on analysts targets of MTSI, see our MTSI price target page. And for a list of of all stocks sorted by upside potential based on analyst target price, see our Top Price Target page.

Average Price Target $70.43 Average Broker Recommendation 1.6 (Moderate Buy)

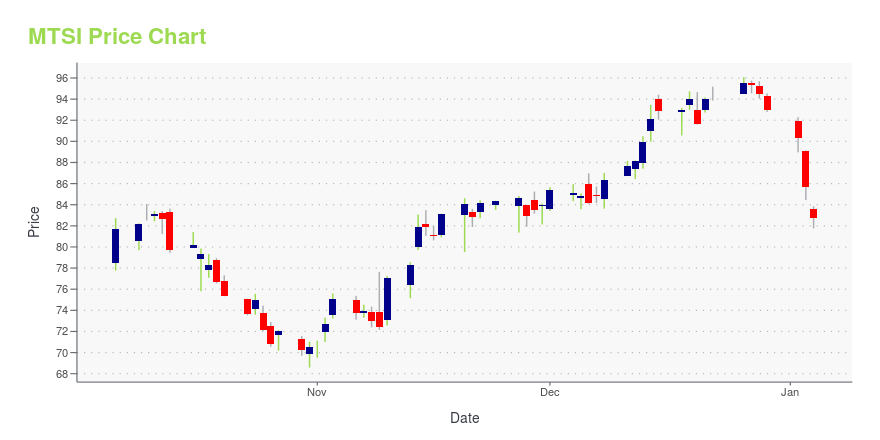
MTSI Stock Price Chart Interactive Chart >

Price chart for MTSI

MTSI Price/Volume Stats

Current price $69.47 52-week high $76.56
Prev. close $67.74 52-week low $42.85
Day low $68.39 Volume 762,100
Day high $70.00 Avg. volume 465,223
50-day MA $68.18 Dividend yield N/A
200-day MA $60.49 Market Cap 4.91B

MACOM Technology Solutions Holdings, Inc. (MTSI) Company Bio


M/A Technology Solutions Holdings designs, develops, manufactures, and markets semiconductors and modules for use in wireless and wireline applications across the radio frequency, microwave, and millimeter-wave spectrum. The company was founded in 2009 in 2009 and is based in Lowell, Massachusetts.


MTSI Latest News Stream


Event/Time News Detail
Loading, please wait...

MTSI Latest Social Stream


Loading social stream, please wait...

View Full MTSI Social Stream

Latest MTSI News From Around the Web

Below are the latest news stories about MACOM TECHNOLOGY SOLUTIONS HOLDINGS INC that investors may wish to consider to help them evaluate MTSI as an investment opportunity.

MACOM (MTSI) Boosts Data Center Reach With New Product Family

MACOM (MTSI) unveils 226Gbps per lane technology product family, which comprises transimpedance amplifiers, externally modulated laser driver and photodiode.

Yahoo | March 10, 2023

MACOM (MTSI) Acquires Linearizer, Expands Product Portfolio

MACOM (MTSI) acquires Linearizer, which is known for correcting distortion in communications systems and linear optical links.

Yahoo | March 9, 2023

Are Robust Financials Driving The Recent Rally In MACOM Technology Solutions Holdings, Inc.'s (NASDAQ:MTSI) Stock?

Most readers would already be aware that MACOM Technology Solutions Holdings' (NASDAQ:MTSI) stock increased...

Yahoo | March 9, 2023

MACOM Announces Availability of 226Gbps per Lane Product Family Targeted for 1.6Tbps Optical Modules

LOWELL, Mass., March 07, 2023--MACOM Technology Solutions Inc. ("MACOM"), a leading supplier of semiconductor products, announced today the release of a 226Gbps per lane technology product family that can enable the development of 1.6TB optical modules.

Yahoo | March 7, 2023

MACOM Announces Acquisition of Linearizer Communications Group

LOWELL, Mass., March 06, 2023--MACOM Technology Solutions Holdings, Inc. ("MACOM") (NASDAQ: MTSI), a leading supplier of semiconductor products, today announced that it has acquired Linearizer Communications Group ("Linearizer"), a developer of industry leading products located in Hamilton, New Jersey.

Yahoo | March 6, 2023

Read More 'MTSI' Stories Here

MTSI Price Returns

1-mo 1.36%
3-mo 10.30%
6-mo 34.14%
1-year 14.30%
3-year 268.74%
5-year 318.49%
YTD 10.30%
2022 -19.57%
2021 42.26%
2020 106.92%
2019 83.32%
2018 -55.41%

Get Free Updates

Join thousands of investors who get the latest news, insights and top rated picks from StockNews.com!


Page generated in 0.9625 seconds.