Manitowoc Company, Inc. (The) (MTW): Price and Financial Metrics
MTW Price/Volume Stats
Current price | $16.18 | 52-week high | $20.20 |
Prev. close | $14.82 | 52-week low | $7.53 |
Day low | $15.16 | Volume | 257,600 |
Day high | $16.23 | Avg. volume | 352,208 |
50-day MA | $15.57 | Dividend yield | N/A |
200-day MA | $12.33 | Market Cap | 568.61M |
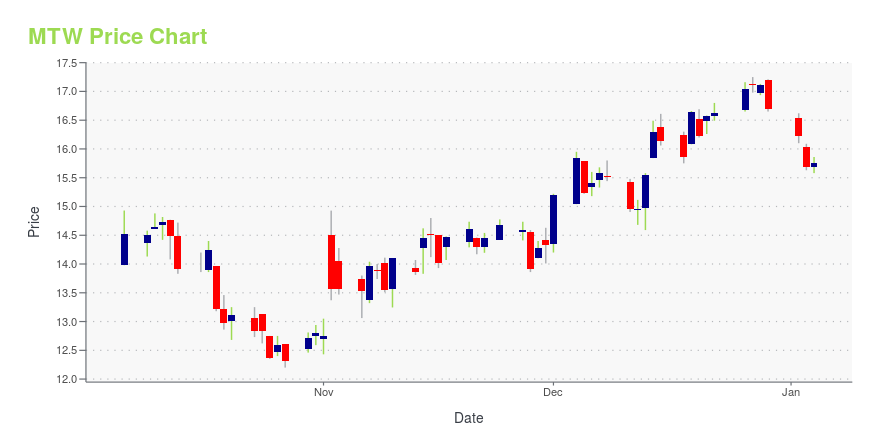
MTW Stock Price Chart Interactive Chart >
MTW POWR Grades
- Value is the dimension where MTW ranks best; there it ranks ahead of 98.89% of US stocks.
- MTW's strongest trending metric is Stability; it's been moving down over the last 179 days.
- MTW ranks lowest in Stability; there it ranks in the 18th percentile.
MTW Stock Summary
- MTW's went public 33.19 years ago, making it older than 86.5% of listed US stocks we're tracking.
- MTW's price/sales ratio is 0.25; that's higher than the P/S ratio of just 8.52% of US stocks.
- In terms of twelve month growth in earnings before interest and taxes, MANITOWOC CO INC is reporting a growth rate of -240.15%; that's higher than merely 6.91% of US stocks.
- Stocks with similar financial metrics, market capitalization, and price volatility to MANITOWOC CO INC are APEI, TDS, SGMA, AVO, and JBLU.
- Visit MTW's SEC page to see the company's official filings. To visit the company's web site, go to en.
MTW Valuation Summary
- MTW's EV/EBIT ratio is -11.8; this is 175.16% lower than that of the median Industrials stock.
- Over the past 243 months, MTW's EV/EBIT ratio has gone down 25.2.
Below are key valuation metrics over time for MTW.
Stock | Date | P/S | P/B | P/E | EV/EBIT |
---|---|---|---|---|---|
MTW | 2023-05-19 | 0.3 | 1 | -5.0 | -11.8 |
MTW | 2023-05-18 | 0.3 | 1 | -5.1 | -11.9 |
MTW | 2023-05-17 | 0.3 | 1 | -4.9 | -11.6 |
MTW | 2023-05-16 | 0.3 | 1 | -4.8 | -11.5 |
MTW | 2023-05-15 | 0.3 | 1 | -4.9 | -11.7 |
MTW | 2023-05-12 | 0.3 | 1 | -4.9 | -11.6 |
MTW Growth Metrics
- Its year over year cash and equivalents growth rate is now at -67.44%.
- Its 3 year net income to common stockholders growth rate is now at 120.53%.
- Its 5 year cash and equivalents growth rate is now at 186.98%.

The table below shows MTW's growth in key financial areas (numbers in millions of US dollars).
Date | Revenue | Operating Cash Flow | Net Income to Common Stock |
---|---|---|---|
2022-12-31 | 2,032.5 | 76.9 | -123.6 |
2022-09-30 | 1,908.7 | 7.6 | 16.9 |
2022-06-30 | 1,858.5 | 32.2 | 14.4 |
2022-03-31 | 1,824.9 | 41 | 17.2 |
2021-12-31 | 1,720.2 | 76.2 | 11 |
2021-09-30 | 1,652.7 | 103.9 | 16.4 |
MTW's Quality Factors
The “Quality” component of the POWR Ratings focuses on 31 different factors of a companies fundamentals and operational strength. Here are some key insights as we drill into the specifics of these quality attributes.- MTW has a Quality Grade of D, ranking ahead of 24.49% of graded US stocks.
- MTW's asset turnover comes in at 0.987 -- ranking 19th of 104 Machinery stocks.
- CAT, IR, and DCI are the stocks whose asset turnover ratios are most correlated with MTW.
The table below shows MTW's key quality metrics over time.
Period | Asset Turnover | Gross Margin | ROIC |
---|---|---|---|
2021-09-30 | 0.987 | 0.185 | 0.059 |
2021-06-30 | 0.986 | 0.188 | 0.068 |
2021-03-31 | 0.914 | 0.177 | 0.033 |
2020-12-31 | 0.904 | 0.176 | 0.026 |
2020-09-30 | 0.923 | 0.174 | 0.028 |
2020-06-30 | 0.981 | 0.179 | 0.042 |
MTW Price Target
For more insight on analysts targets of MTW, see our MTW price target page. And for a list of of all stocks sorted by upside potential based on analyst target price, see our Top Price Target page.
Average Price Target | $26.22 | Average Broker Recommendation | 1.85 (Hold) |
Manitowoc Company, Inc. (The) (MTW) Company Bio
Manitowoc Company designs, manufactures, and sells cranes and related products, and foodservice equipment worldwide. The company was founded in 1853 and is based in Manitowoc, Wisconsin.
Latest MTW News From Around the Web
Below are the latest news stories about MANITOWOC CO INC that investors may wish to consider to help them evaluate MTW as an investment opportunity.
Manitowoc (MTW) Up 63% in 6 Months: Will the Trend Continue?Manitowoc (MTW) is gaining on the back of its improving demand, pricing actions and cost-saving efforts which have been driving earnings growth. |
Has Ingersoll Rand (IR) Outpaced Other Industrial Products Stocks This Year?Here is how Ingersoll Rand (IR) and The Manitowoc Company, Inc. (MTW) have performed compared to their sector so far this year. |
Will The Manitowoc Company, Inc. (MTW) Gain on Rising Earnings Estimates?The Manitowoc Company, Inc. (MTW) shares have started gaining and might continue moving higher in the near term, as indicated by solid earnings estimate revisions. |
Despite Fast-paced Momentum, The Manitowoc Company, Inc. (MTW) Is Still a Bargain StockThe Manitowoc Company, Inc. (MTW) made it through our 'Fast-Paced Momentum at a Bargain' screen and could be a great choice for investors looking for stocks that have gained strong momentum recently but are still trading at reasonable prices. |
Beat the Market the Zacks Way: Procter & Gamble, McDonald's, NVIDIA in FocusOur time-tested methodologies were at work to help investors navigate the market well last week. Here are some of our key performance data from the past three months. |
MTW Price Returns
1-mo | 6.03% |
3-mo | -17.28% |
6-mo | 69.25% |
1-year | 20.84% |
3-year | 58.01% |
5-year | -34.25% |
YTD | 76.64% |
2022 | -50.73% |
2021 | 39.67% |
2020 | -23.94% |
2019 | 18.48% |
2018 | -62.46% |
Continue Researching MTW
Here are a few links from around the web to help you further your research on Manitowoc Co Inc's stock as an investment opportunity:Manitowoc Co Inc (MTW) Stock Price | Nasdaq
Manitowoc Co Inc (MTW) Stock Quote, History and News - Yahoo Finance
Manitowoc Co Inc (MTW) Stock Price and Basic Information | MarketWatch
Loading social stream, please wait...