
Mullen Automotive Inc. (MULN): Price and Financial Metrics
MULN Price/Volume Stats
| Current price | $1.15 | 52-week high | $155.70 |
| Prev. close | $1.20 | 52-week low | $1.11 |
| Day low | $1.13 | Volume | 3,503,450 |
| Day high | $1.20 | Avg. volume | 2,819,842 |
| 50-day MA | $2.88 | Dividend yield | N/A |
| 200-day MA | $9.93 | Market Cap | 18.44M |
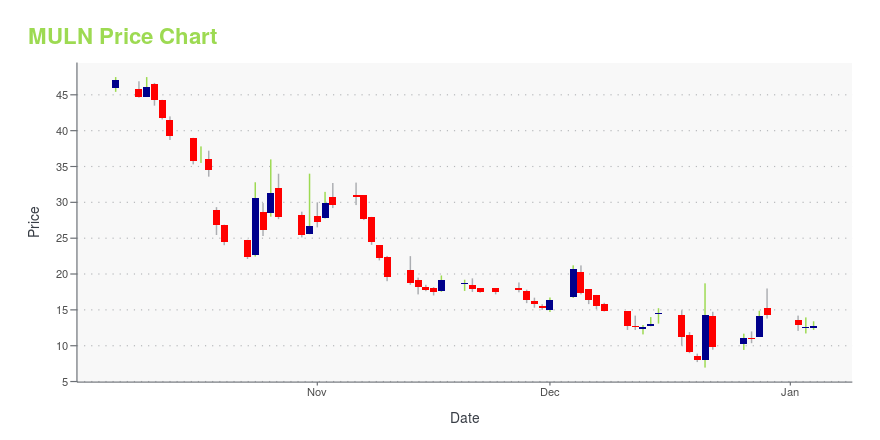
MULN Stock Price Chart Interactive Chart >
Mullen Automotive Inc. (MULN) Company Bio
Mullen Automotive Inc. operates as an electric car company. It develops electric vehicles and energy solutions. The company was founded by David Michery in 2014 and is headquartered in Brea, California.
Latest MULN News From Around the Web
Below are the latest news stories about MULLEN AUTOMOTIVE INC that investors may wish to consider to help them evaluate MULN as an investment opportunity.
Why Is Mullen Automotive (MULN) Stock Up 25% Today?With Mullen Automotive delivering another set of vehicles, MULN stock enjoyed a credibility lift. |
ARK's crypto moves, Boeing, Mullen Automotive: Trending tickersCathie Wood's Ark Invest has made some changes in its Next Generation Internet ETF (ARKW), exiting its position in the Grayscale Bitcoin Trust (GBTC) and buying the ProShares Bitcoin Strategy ETF (BITO). Wood says that the move was made in case the Grayscale Bitcoin Trust conversion to an ETF is not approved by the Securities and Exchange Commission. In an interview with Yahoo Finance earlier this week, Wood says she expects the SEC to approve a number of spot bitcoin ETFs all at once when a deadline is reached next month. Boeing (BA) has urged airlines to inspect 737 Max jets over a potential loose bolt. EV startup Mullen Automotive (MULN) saw its stock jump after announcing delivery of 50 electric cargo vans to a dealership group for $1.7 million. For more expert insight and the late... |
Mullen Delivers 50 Class 1 EV Cargo Vans and Invoices Randy Marion Automotive Group for $1,680,000Mullen delivers 50 Class 1 EV cargo vans to Randy Marion Automotive Group Randy Marion, based in Charlotte, North Carolina, is one of the top commercial dealer groups in the U.S. Mullen intends to deliver 285 Class 1 vehicles within the next five business days Mullen to close fiscal first quarter on Dec. 31 with over $6,054,300 invoiced for Class 1 vehicles Vehicles delivered to Randy Marion are part of the 6,000 Class 1 vehicle purchase order of $200,000,000; majority of vehicles to be delivere |
MULN Stock Alert: Mullen Enters New Phase of Battery Pack TestingAlthough Mullen Automotive delivered seemingly exciting technology and delivery news, skepticism still clouds MULN stock. |
Mullen Completes Solid-State Polymer Cell to Pack Integration and Begins Class 1 Battery Pack TestingMullen on track to begin Class 1 vehicle road testing of solid-state packs in Q1 2024 Class 1 projected vehicle range increases to over 190 miles with solid-state packs. Solid-state polymer pack level test and validation for Class 1 EV cargo vans begins Dec. 28, 2023Vehicle road testing of solid-state battery packs in Class 1 EV cargo vans on track for Q1 2024110 miles current LFP range projected to increase to over 190 SSP miles range, a 73% increase, providing a superior, clean and safe altern |
MULN Price Returns
| 1-mo | -53.63% |
| 3-mo | -63.61% |
| 6-mo | -82.78% |
| 1-year | -98.97% |
| 3-year | -100.00% |
| 5-year | -100.00% |
| YTD | -91.95% |
| 2023 | -99.78% |
| 2022 | -94.53% |
| 2021 | -62.51% |
| 2020 | 334.58% |
| 2019 | -43.88% |
Loading social stream, please wait...