Murphy USA Inc. (MUSA): Price and Financial Metrics
GET POWR RATINGS... FREE!
MUSA POWR Grades
- MUSA scores best on the Value dimension, with a Value rank ahead of 93.4% of US stocks.
- The strongest trend for MUSA is in Growth, which has been heading down over the past 179 days.
- MUSA's current lowest rank is in the Sentiment metric (where it is better than 9.24% of US stocks).
MUSA Stock Summary
- MURPHY USA INC's capital turnover -- a measure of revenue relative to shareholder's equity -- is better than 99.1% of US listed stocks.
- With a price/sales ratio of 0.23, MURPHY USA INC has a higher such ratio than only 7.65% of stocks in our set.
- Shareholder yield, a measure of how much is returned to shareholders via dividends and share repurchases, for MUSA comes in at 16.32% -- higher than that of 88.96% of stocks in our set.
- Stocks that are quantitatively similar to MUSA, based on their financial statements, market capitalization, and price volatility, are AE, QRTEA, PAGP, ARKO, and GLP.
- Visit MUSA's SEC page to see the company's official filings. To visit the company's web site, go to www.murphyusa.com.
MUSA Valuation Summary
- In comparison to the median Consumer Cyclical stock, MUSA's price/sales ratio is 88.89% lower, now standing at 0.2.
- Over the past 117 months, MUSA's price/sales ratio has gone up 0.1.
Below are key valuation metrics over time for MUSA.
Stock | Date | P/S | P/B | P/E | EV/EBIT |
---|---|---|---|---|---|
MUSA | 2023-03-17 | 0.2 | 8.3 | 7.9 | 7.7 |
MUSA | 2023-03-16 | 0.2 | 8.4 | 8.0 | 7.8 |
MUSA | 2023-03-15 | 0.2 | 8.1 | 7.8 | 7.6 |
MUSA | 2023-03-14 | 0.2 | 8.1 | 7.7 | 7.6 |
MUSA | 2023-03-13 | 0.2 | 8.3 | 7.9 | 7.7 |
MUSA | 2023-03-10 | 0.2 | 8.6 | 8.2 | 7.9 |
MUSA Growth Metrics
- Its 2 year net cashflow from operations growth rate is now at 123.49%.
- Its 3 year revenue growth rate is now at 33.06%.
- Its 3 year cash and equivalents growth rate is now at 97.45%.

The table below shows MUSA's growth in key financial areas (numbers in millions of US dollars).
Date | Revenue | Operating Cash Flow | Net Income to Common Stock |
---|---|---|---|
2022-12-31 | 23,446.1 | 994.7 | 672.9 |
2022-09-30 | 22,846.8 | 921.9 | 664 |
2022-06-30 | 21,252.5 | 923.1 | 548.5 |
2022-03-31 | 18,941.8 | 846.8 | 494 |
2021-12-31 | 17,360.5 | 737.4 | 396.9 |
2021-09-30 | 15,454.4 | 682.9 | 349.1 |
MUSA's Quality Factors
The “Quality” component of the POWR Ratings focuses on 31 different factors of a companies fundamentals and operational strength. Here are some key insights as we drill into the specifics of these quality attributes.- MUSA has a Quality Grade of C, ranking ahead of 64.59% of graded US stocks.
- MUSA's asset turnover comes in at 4.192 -- ranking 4th of 165 Retail stocks.
- PSMT, JWN, and ROST are the stocks whose asset turnover ratios are most correlated with MUSA.
The table below shows MUSA's key quality metrics over time.
Period | Asset Turnover | Gross Margin | ROIC |
---|---|---|---|
2021-09-30 | 4.192 | 0.060 | 0.123 |
2021-06-30 | 4.075 | 0.063 | 0.123 |
2021-03-31 | 3.773 | 0.076 | 0.154 |
2020-12-31 | 4.127 | 0.079 | 0.189 |
2020-09-30 | 4.346 | 0.073 | 0.184 |
2020-06-30 | 4.720 | 0.068 | 0.188 |
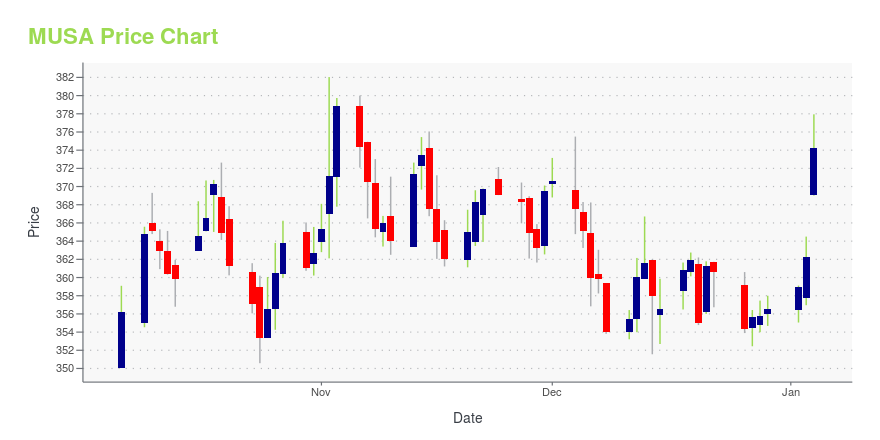
MUSA Stock Price Chart Interactive Chart >
MUSA Price/Volume Stats
Current price | $245.98 | 52-week high | $323.00 |
Prev. close | $246.74 | 52-week low | $189.30 |
Day low | $243.01 | Volume | 178,700 |
Day high | $248.49 | Avg. volume | 318,595 |
50-day MA | $259.88 | Dividend yield | 0.6% |
200-day MA | $273.79 | Market Cap | 5.34B |
Murphy USA Inc. (MUSA) Company Bio
Murphy USA Inc. operates a chain of retail stations offering motor fuel products and convenience merchandise. The company was founded in 2013 and is based in El Dorado, Arkansas.
Latest MUSA News From Around the Web
Below are the latest news stories about MURPHY USA INC that investors may wish to consider to help them evaluate MUSA as an investment opportunity.
Here's Why Retain Strategy is Apt for ConocoPhillips (COP) NowFavorable oil price is aiding ConocoPhillips' (COP) bottom line. |
10 High Growth Retail Stocks That Are ProfitableIn this article, we will discuss the 10 high growth retail stocks that are profitable. You can skip our industry overview and go directly to the 5 High Growth Retail Stocks That Are Profitable. The global surge in inflation rates has resulted in reduced consumer spending growth in real terms, creating a challenging economic landscape […] |
Here's Why Hold Strategy is Apt for ExxonMobil (XOM) NowFavorable oil price is a boon for ExxonMobil's (XOM) upstream operations. |
Equinor (EQNR) to Divest Interest in Statfjord Area to OKEAEquinor (EQNR) has entered into an agreement to sell 28% working interest in Statfjord area to a seasoned business partner OKEA. |
Petrobras (PBR) Shares Dip After CARF Appeal DismissedPetrobras' (PBR) appeal has been rejected in a case involving unpaid taxes, which might cost the company R$18 billion. |
MUSA Price Returns
1-mo | -7.70% |
3-mo | -16.04% |
6-mo | -7.27% |
1-year | 30.00% |
3-year | 186.27% |
5-year | 253.67% |
YTD | -11.89% |
2022 | 41.02% |
2021 | 53.33% |
2020 | 12.06% |
2019 | 52.66% |
2018 | -4.63% |
MUSA Dividends
Ex-Dividend Date | Type | Payout Amount | Change | ||||||
---|---|---|---|---|---|---|---|---|---|
Loading, please wait... |
Continue Researching MUSA
Want to see what other sources are saying about Murphy USA Inc's financials and stock price? Try the links below:Murphy USA Inc (MUSA) Stock Price | Nasdaq
Murphy USA Inc (MUSA) Stock Quote, History and News - Yahoo Finance
Murphy USA Inc (MUSA) Stock Price and Basic Information | MarketWatch
Loading social stream, please wait...