
MicroVision, Inc. (MVIS): Price and Financial Metrics
MVIS Price/Volume Stats
| Current price | $1.12 | 52-week high | $4.04 |
| Prev. close | $1.16 | 52-week low | $0.86 |
| Day low | $1.08 | Volume | 1,593,300 |
| Day high | $1.19 | Avg. volume | 2,369,500 |
| 50-day MA | $1.11 | Dividend yield | N/A |
| 200-day MA | $1.87 | Market Cap | 231.46M |
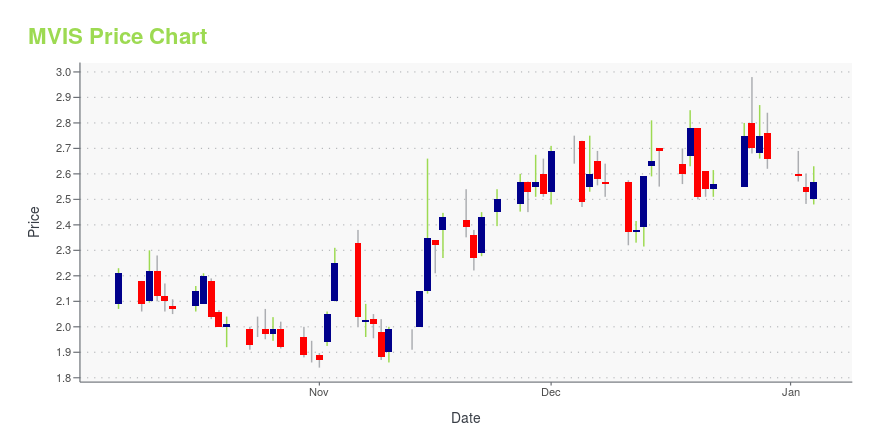
MVIS Stock Price Chart Interactive Chart >
MicroVision, Inc. (MVIS) Company Bio
MicroVision, Inc. engages in the development of PicoP display technology that can be used by its customers to create miniature laser display and imaging engines in the United States. The company was founded in 1993 and is based in Redmond, Washington.
Latest MVIS News From Around the Web
Below are the latest news stories about MICROVISION INC that investors may wish to consider to help them evaluate MVIS as an investment opportunity.
MicroVision (MVIS) Reaffirms Revenue Guidance for This YearMicroVision (MVIS) reaffirms its revenue guidance for 2023 and reveals that it is discussing partnering with OEMs for the implementation of LiDAR-based advanced safety systems in vehicles. |
MicroVision Reiterates Revenue Guidance and Provides Updates on OEM EngagementsREDMOND, WA / ACCESSWIRE / December 14, 2023 / MicroVision, Inc. (NASDAQ:MVIS), a leader in MEMS-based solid-state automotive lidar technology and ADAS solutions, today reiterated its 2023 revenue guidance and provided updates on engagement with OEMs."As ... |
Luxoft and MicroVision Join Forces to Enhance ADAS Automated Testing at ScaleZUG, SWITZERLAND / ACCESSWIRE / December 4, 2023 / Luxoft, a DXC Technology Company, have teamed up with MicroVision (NASDAQ:MVIS) to set the foundation for a new generation of testing and simulation environments.Modern advanced driver assistance ... |
MicroVision Directors and Executive Team to Purchase SharesREDMOND, WA / ACCESSWIRE / November 14, 2023 / MicroVision, Inc. (Nasdaq:MVIS), a leader in MEMS-based solid-state automotive lidar technology and ADAS solutions, today announced its executive management team and several members of its Board of Directors ... |
MicroVision, Inc. (NASDAQ:MVIS) Q3 2023 Earnings Call TranscriptMicroVision, Inc. (NASDAQ:MVIS) Q3 2023 Earnings Call Transcript November 8, 2023 Operator: Good afternoon, and welcome to the MicroVision Third Quarter 2023 Financial and Operating Results Conference Call. At this time, all participants are in a listen-only mode. [Operator Instructions] Please note this event is being recorded. I would now like to turn the conference […] |
MVIS Price Returns
| 1-mo | 4.67% |
| 3-mo | -25.33% |
| 6-mo | -53.14% |
| 1-year | -68.54% |
| 3-year | -91.66% |
| 5-year | 67.16% |
| YTD | -57.89% |
| 2023 | 13.19% |
| 2022 | -53.09% |
| 2021 | -6.88% |
| 2020 | 647.22% |
| 2019 | 20.00% |
Continue Researching MVIS
Want to do more research on Microvision Inc's stock and its price? Try the links below:Microvision Inc (MVIS) Stock Price | Nasdaq
Microvision Inc (MVIS) Stock Quote, History and News - Yahoo Finance
Microvision Inc (MVIS) Stock Price and Basic Information | MarketWatch
Loading social stream, please wait...