
Mexco Energy Corporation (MXC): Price and Financial Metrics
MXC Price/Volume Stats
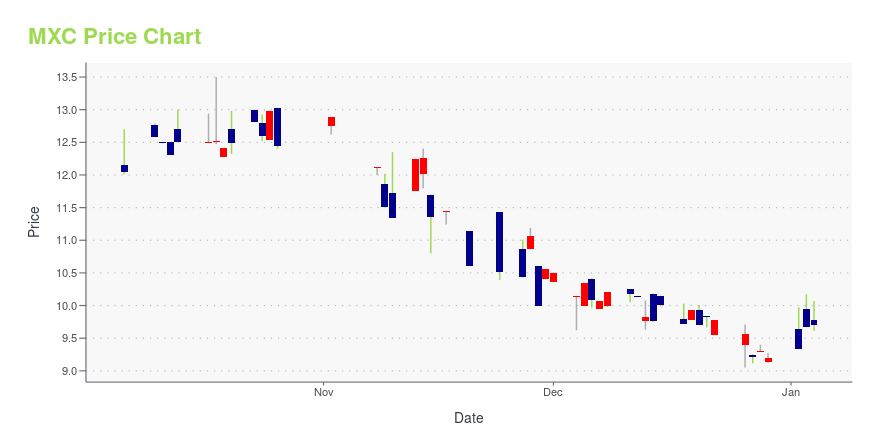
| Current price | $10.98 | 52-week high | $16.52 |
| Prev. close | $11.19 | 52-week low | $9.02 |
| Day low | $10.98 | Volume | 3,100 |
| Day high | $11.97 | Avg. volume | 5,925 |
| 50-day MA | $11.68 | Dividend yield | N/A |
| 200-day MA | $11.36 | Market Cap | 22.95M |
MXC Stock Price Chart Interactive Chart >
Mexco Energy Corporation (MXC) Company Bio
Mexco Energy Corporation provides oil and gas services. The Company and its wholly owned subsidiary, Forman Energy Corporation, are involved in the acquisition, exploration, development, and production of oil and gas. Mexco operates primarily in the Permian Basin of West Texas owns producing properties and undeveloped acreage in other states.
Latest MXC News From Around the Web
Below are the latest news stories about MEXCO ENERGY CORP that investors may wish to consider to help them evaluate MXC as an investment opportunity.
Mexco Energy Corp (MXC) Reports Decrease in Net Income and Operating RevenuesFinancial Performance for the First Six Months of Fiscal 2024 |
Mexco Energy Corporation Reports Financial Results for Six MonthsMIDLAND, TX, Nov. 08, 2023 (GLOBE NEWSWIRE) -- Mexco Energy Corporation (NYSE American: MXC) today reported net income for the six months ending September 30, 2023 was $735,047, or $0.34 per diluted share, a decrease of 71% compared to the same six-month period of fiscal 2023. Operating revenues in the first six months of fiscal 2024 decreased 34% to $3,155,029. This decrease resulted from a 26% decrease in the average sales price of oil and a 68% decrease in the average sales price of natural g |
Mexco Energy Corporation Reports Financial Results for First QuarterMIDLAND, TX, Aug. 10, 2023 (GLOBE NEWSWIRE) -- Mexco Energy Corporation (NYSE American: MXC) today reported net income of $465,614, or $0.21 per diluted share, for the quarter ending June 30, 2023, compared to $1,298,672 or $0.59 per diluted share, for the comparable quarter ending June 30, 2022. Operating revenues in the first quarter of fiscal 2024 were $1,748,419, a decrease of 29% from the first quarter of fiscal 2023. This was due to a 33% decrease in the average sales price of oil and a 69 |
MEXCO ENERGY CORPORATION REPORTS FINANCIAL RESULTS FOR FISCAL 2023MIDLAND, TX, June 26, 2023 (GLOBE NEWSWIRE) -- Mexco Energy Corporation (NYSE American: MXC) reported results on its Annual Report, Form 10-K to the Securities and Exchange Commission for the fiscal year ended March 31, 2023. The Company reported net income of $4,662,702 or $2.11 per diluted share, for fiscal year 2023, compared to net income of $2,855,066, or $1.32 per diluted share, for fiscal 2022, an increase of 63%. Operating revenues in fiscal 2023 were $9,557,289, an increase of 45% when |
Historic Milestone: UK Patients Receive First CannEpil® Delivery through 'I AM Billy Foundation' and GMC Specialist RegisterMGC Pharmaceuticals Ltd. (LSE: MXC), (ASX: MXC), (OTC: MGCLF), a leading European pharmaceutical firm specializing in plant-derived medications, announced today that its ground-breaking Investigational Medicinal Product (IMP), CannEpil®, has been successfully imported and received by its first patients in the United Kingdom. |
MXC Price Returns
| 1-mo | -6.31% |
| 3-mo | -11.45% |
| 6-mo | 8.07% |
| 1-year | -14.62% |
| 3-year | 28.12% |
| 5-year | 160.55% |
| YTD | 20.26% |
| 2023 | -26.84% |
| 2022 | 33.05% |
| 2021 | 55.56% |
| 2020 | 53.05% |
| 2019 | 42.24% |
Continue Researching MXC
Want to see what other sources are saying about Mexco Energy Corp's financials and stock price? Try the links below:Mexco Energy Corp (MXC) Stock Price | Nasdaq
Mexco Energy Corp (MXC) Stock Quote, History and News - Yahoo Finance
Mexco Energy Corp (MXC) Stock Price and Basic Information | MarketWatch
Loading social stream, please wait...