MaxLinear, Inc. (MXL): Price and Financial Metrics
MXL Price/Volume Stats
Current price | $19.01 | 52-week high | $43.66 |
Prev. close | $18.87 | 52-week low | $13.43 |
Day low | $18.91 | Volume | 604,300 |
Day high | $19.50 | Avg. volume | 862,900 |
50-day MA | $18.93 | Dividend yield | N/A |
200-day MA | $26.18 | Market Cap | 1.55B |
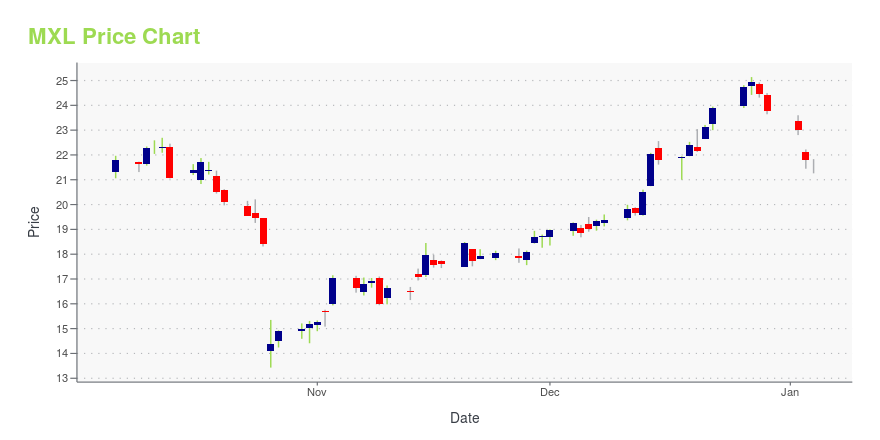
MXL Stock Price Chart Interactive Chart >
MXL POWR Grades
- MXL scores best on the Value dimension, with a Value rank ahead of 95.08% of US stocks.
- The strongest trend for MXL is in Growth, which has been heading down over the past 177 days.
- MXL ranks lowest in Growth; there it ranks in the 2nd percentile.
MXL Stock Summary
- MXL's one year PEG ratio, measuring expected growth in earnings next year relative to current common stock price is 524.64 -- higher than 93.95% of US-listed equities with positive expected earnings growth.
- With a year-over-year growth in debt of -23.6%, MAXLINEAR INC's debt growth rate surpasses only 13.97% of about US stocks.
- As for revenue growth, note that MXL's revenue has grown -20.33% over the past 12 months; that beats the revenue growth of merely 13.85% of US companies in our set.
- Stocks with similar financial metrics, market capitalization, and price volatility to MAXLINEAR INC are FORM, MBLY, ALTR, SRDX, and MRVL.
- Visit MXL's SEC page to see the company's official filings. To visit the company's web site, go to www.maxlinear.com.
MXL Valuation Summary
- In comparison to the median Technology stock, MXL's price/earnings ratio is 1703.88% lower, now standing at -413.8.
- MXL's price/sales ratio has moved down 9 over the prior 167 months.
Below are key valuation metrics over time for MXL.
Stock | Date | P/S | P/B | P/E | EV/EBIT |
---|---|---|---|---|---|
MXL | 2023-11-28 | 1.7 | 2.1 | -413.8 | 48.6 |
MXL | 2023-11-27 | 1.7 | 2.1 | -407.7 | 47.8 |
MXL | 2023-11-24 | 1.7 | 2.1 | -412.7 | 48.4 |
MXL | 2023-11-22 | 1.7 | 2.1 | -410.2 | 48.1 |
MXL | 2023-11-21 | 1.7 | 2.1 | -404.9 | 47.5 |
MXL | 2023-11-20 | 1.8 | 2.1 | -421.9 | 49.5 |
MXL Growth Metrics
- The 4 year price growth rate now stands at -35.53%.
- The 2 year revenue growth rate now stands at 221.47%.
- The 3 year net income to common stockholders growth rate now stands at 318.11%.

The table below shows MXL's growth in key financial areas (numbers in millions of US dollars).
Date | Revenue | Operating Cash Flow | Net Income to Common Stock |
---|---|---|---|
2022-12-31 | 1,120.252 | 388.726 | 125.04 |
2022-09-30 | 1,077.555 | 335.402 | 122.136 |
2022-06-30 | 1,021.599 | 357.713 | 102.986 |
2022-03-31 | 946.966 | 262.127 | 71.753 |
2021-12-31 | 892.398 | 168.233 | 41.969 |
2021-09-30 | 839.225 | 226.469 | -10.879 |
MXL's Quality Factors
The “Quality” component of the POWR Ratings focuses on 31 different factors of a companies fundamentals and operational strength. Here are some key insights as we drill into the specifics of these quality attributes.- MXL has a Quality Grade of C, ranking ahead of 62.76% of graded US stocks.
- MXL's asset turnover comes in at 0.818 -- ranking 78th of 208 Electronic Equipment stocks.
- SUNW, ALPP, and LEDS are the stocks whose asset turnover ratios are most correlated with MXL.
The table below shows MXL's key quality metrics over time.
Period | Asset Turnover | Gross Margin | ROIC |
---|---|---|---|
2021-09-30 | 0.818 | 0.521 | 0.011 |
2021-06-30 | 0.756 | 0.488 | -0.098 |
2021-03-31 | 0.673 | 0.469 | -0.151 |
2020-12-31 | 0.560 | 0.445 | -0.236 |
2020-09-30 | 0.457 | 0.470 | -0.222 |
2020-06-30 | 0.396 | 0.512 | -0.155 |
MXL Price Target
For more insight on analysts targets of MXL, see our MXL price target page. And for a list of of all stocks sorted by upside potential based on analyst target price, see our Top Price Target page.
Average Price Target | $52.50 | Average Broker Recommendation | 1.55 (Moderate Buy) |
MaxLinear, Inc. (MXL) Company Bio
MaxLinear Inc. provides integrated, radio-frequency (RF) and mixed-signal circuits for broadband communication and data center, metro, and long-haul transport network applications worldwide. The company was founded in 2003 and is based in Carlsbad, California.
Latest MXL News From Around the Web
Below are the latest news stories about MAXLINEAR INC that investors may wish to consider to help them evaluate MXL as an investment opportunity.
Not Worth It! 3 Risky Stocks to Get Rid Of NowEven though U.S. markets may be entering rally territory, equities investors should avoid these 3 risky stocks. |
What Does MaxLinear, Inc.'s (NASDAQ:MXL) Share Price Indicate?MaxLinear, Inc. ( NASDAQ:MXL ), is not the largest company out there, but it received a lot of attention from a... |
7 F-Rated AI Stocks to Skip in NovemberAI stocks are popular in 2023 and that will likely continue into 2024, but the names on this list are AI stocks to avoid right now. |
1 Small Chip Stock to Consider for a New Era of AIIt's been a drama-filled year for small-cap chip designer SiliconMotion, but better times could be coming. |
MaxLinear Launches Single-Port 1G Ethernet PHY Family Aimed at Both Consumer and Industrial IOT ApplicationsCARLSBAD, Calif., November 08, 2023--MaxLinear Launches Single-Port 1G Ethernet PHY Family Aimed at Both Consumer and Industrial IOT Applications |
MXL Price Returns
1-mo | 13.09% |
3-mo | -17.28% |
6-mo | -34.74% |
1-year | -45.17% |
3-year | -42.34% |
5-year | 0.69% |
YTD | -44.01% |
2022 | -54.97% |
2021 | 97.41% |
2020 | 79.97% |
2019 | 20.57% |
2018 | -33.38% |
Continue Researching MXL
Want to do more research on Maxlinear Inc's stock and its price? Try the links below:Maxlinear Inc (MXL) Stock Price | Nasdaq
Maxlinear Inc (MXL) Stock Quote, History and News - Yahoo Finance
Maxlinear Inc (MXL) Stock Price and Basic Information | MarketWatch
Loading social stream, please wait...