Myomo, Inc. (MYO): Price and Financial Metrics
GET POWR RATINGS... FREE!
MYO Price/Volume Stats
Current price | $0.53 | 52-week high | $2.39 |
Prev. close | $0.51 | 52-week low | $0.37 |
Day low | $0.51 | Volume | 329,600 |
Day high | $0.57 | Avg. volume | 706,508 |
50-day MA | $0.60 | Dividend yield | N/A |
200-day MA | $0.93 | Market Cap | 11.18M |
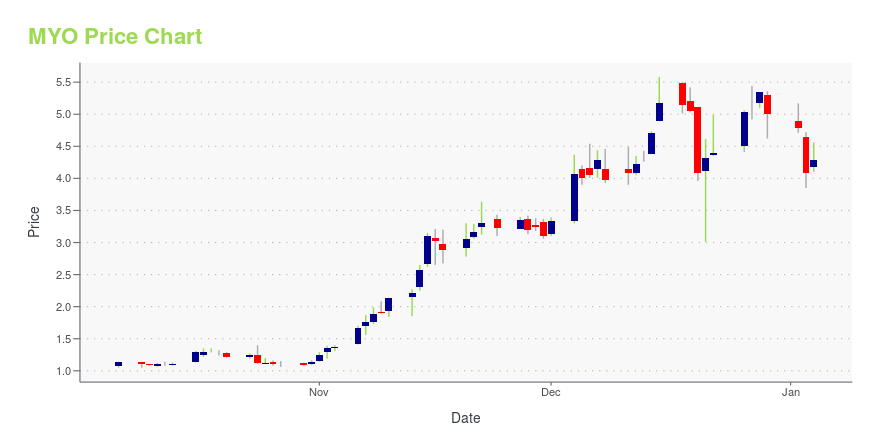
MYO Stock Price Chart Interactive Chart >
MYO POWR Grades
- MYO scores best on the Sentiment dimension, with a Sentiment rank ahead of 99.18% of US stocks.
- The strongest trend for MYO is in Growth, which has been heading up over the past 98 days.
- MYO's current lowest rank is in the Stability metric (where it is better than 9.1% of US stocks).
MYO Stock Summary
- MYO has a higher market value than only 3.96% of US stocks; more precisely, its current market capitalization is $9,520,155.
- With a year-over-year growth in debt of -48.49%, MYOMO INC's debt growth rate surpasses just 6.07% of about US stocks.
- The volatility of MYOMO INC's share price is greater than that of 94.22% US stocks with at least 200 days of trading history.
- If you're looking for stocks that are quantitatively similar to MYOMO INC, a group of peers worth examining would be BSQR, FTFT, PWFL, KNDI, and PMD.
- MYO's SEC filings can be seen here. And to visit MYOMO INC's official web site, go to www.myomo.com.
MYO Valuation Summary
- In comparison to the median Healthcare stock, MYO's EV/EBIT ratio is 100.83% lower, now standing at -0.1.
- Over the past 72 months, MYO's price/earnings ratio has gone up 4.5.
Below are key valuation metrics over time for MYO.
Stock | Date | P/S | P/B | P/E | EV/EBIT |
---|---|---|---|---|---|
MYO | 2023-05-23 | 0.6 | 1.0 | -0.9 | -0.1 |
MYO | 2023-05-22 | 0.6 | 0.9 | -0.9 | 0.0 |
MYO | 2023-05-19 | 0.6 | 1.0 | -0.9 | 0.0 |
MYO | 2023-05-18 | 0.6 | 1.0 | -0.9 | -0.1 |
MYO | 2023-05-17 | 0.7 | 1.0 | -0.9 | -0.1 |
MYO | 2023-05-16 | 0.7 | 1.1 | -1.0 | -0.1 |
MYO's Quality Factors
The “Quality” component of the POWR Ratings focuses on 31 different factors of a companies fundamentals and operational strength. Here are some key insights as we drill into the specifics of these quality attributes.- MYO has a Quality Grade of D, ranking ahead of 5.17% of graded US stocks.
- MYO's asset turnover comes in at 0.65 -- ranking 59th of 186 Medical Equipment stocks.
- BDX, ATRI, and BTCY are the stocks whose asset turnover ratios are most correlated with MYO.
The table below shows MYO's key quality metrics over time.
Period | Asset Turnover | Gross Margin | ROIC |
---|---|---|---|
2021-06-30 | 0.650 | 0.696 | -26.424 |
2021-03-31 | 0.559 | 0.674 | -133.294 |
2020-12-31 | 0.516 | 0.657 | 78.522 |
2020-09-30 | 0.419 | 0.644 | -102.361 |
2020-06-30 | 0.386 | 0.692 | -74.662 |
2020-03-31 | 0.433 | 0.736 | -76.097 |
Myomo, Inc. (MYO) Company Bio
Myomo, Inc. operates as a medical robotics company. The Company offers expanded mobility for those suffering from neurological disorders and upper-limb paralysis. Myomo develops and markets arm braces to restore function in the paralyzed and weakened arms and hands of individuals that have suffered a stroke, spinal cord, and nerve injury.
Latest MYO News From Around the Web
Below are the latest news stories about MYOMO INC that investors may wish to consider to help them evaluate MYO as an investment opportunity.
Here's Why Myomo, Inc. (MYO) Is a Great 'Buy the Bottom' Stock NowMyomo, Inc. (MYO) appears to have found support after losing some value lately, as indicated by the formation of a hammer chart. In addition to this technical chart pattern, strong agreement among Wall Street analysts in revising earnings estimates higher enhances the stock's potential for a turnaround in the near term. |
Myomo, Inc. (MYO) Reports Q1 Loss, Tops Revenue EstimatesMyomo, Inc. (MYO) delivered earnings and revenue surprises of 26.67% and 3.51%, respectively, for the quarter ended March 2023. Do the numbers hold clues to what lies ahead for the stock? |
Supernus Pharmaceuticals (SUPN) Q1 Earnings and Revenues Beat EstimatesSupernus (SUPN) delivered earnings and revenue surprises of 141.67% and 8.99%, respectively, for the quarter ended March 2023. Do the numbers hold clues to what lies ahead for the stock? |
Owens & Minor (OMI) Beats Q1 Earnings and Revenue EstimatesOwens & Minor (OMI) delivered earnings and revenue surprises of 155.56% and 4.15%, respectively, for the quarter ended March 2023. Do the numbers hold clues to what lies ahead for the stock? |
Myomo to Report First Quarter Financial Results on May 10, 2023BOSTON, May 03, 2023--Myomo, Inc. (NYSE American: MYO) ("Myomo" or the "Company"), a wearable medical robotics company that offers increased functionality for those suffering from neurological disorders and upper-limb paralysis, today announced that it will report financial results for the three months ended March 31, 2023 on May 10, 2023. |
MYO Price Returns
1-mo | -10.18% |
3-mo | -18.34% |
6-mo | -13.00% |
1-year | -74.76% |
3-year | -85.98% |
5-year | -99.45% |
YTD | 3.64% |
2022 | -92.53% |
2021 | 1.71% |
2020 | -25.42% |
2019 | -79.11% |
2018 | -61.60% |
Continue Researching MYO
Want to do more research on Myomo Inc's stock and its price? Try the links below:Myomo Inc (MYO) Stock Price | Nasdaq
Myomo Inc (MYO) Stock Quote, History and News - Yahoo Finance
Myomo Inc (MYO) Stock Price and Basic Information | MarketWatch
Loading social stream, please wait...