Navient Corporation (NAVI): Price and Financial Metrics
NAVI Price/Volume Stats
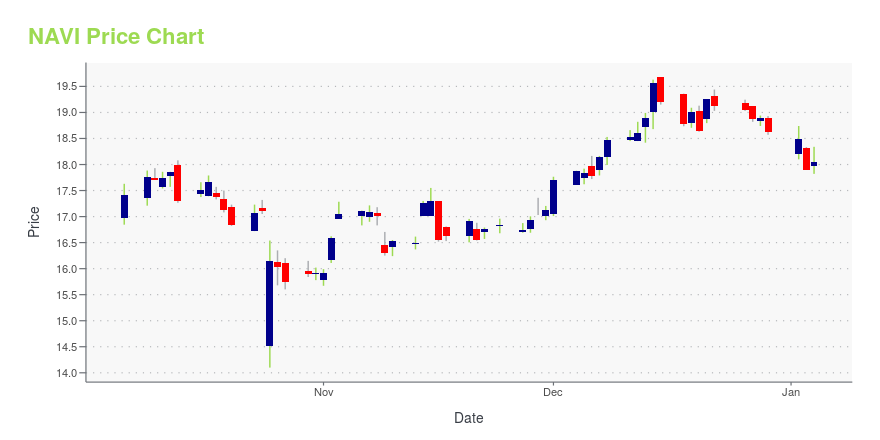
Current price | $18.23 | 52-week high | $19.34 |
Prev. close | $17.80 | 52-week low | $12.45 |
Day low | $17.79 | Volume | 1,726,900 |
Day high | $18.28 | Avg. volume | 1,013,291 |
50-day MA | $15.84 | Dividend yield | 3.75% |
200-day MA | $16.15 | Market Cap | 2.31B |
NAVI Stock Price Chart Interactive Chart >
NAVI POWR Grades
- Value is the dimension where NAVI ranks best; there it ranks ahead of 87.15% of US stocks.
- The strongest trend for NAVI is in Growth, which has been heading down over the past 179 days.
- NAVI's current lowest rank is in the Growth metric (where it is better than 28.63% of US stocks).
NAVI Stock Summary
- For NAVI, its debt to operating expenses ratio is greater than that reported by 98.81% of US equities we're observing.
- NAVI's equity multiplier -- a measure of assets relative to shareholders'equity -- is greater than that of 98.22% of US stocks.
- Shareholder yield, a measure of how much is returned to shareholders via dividends and share repurchases, for NAVI comes in at 609.7% -- higher than that of 99.33% of stocks in our set.
- Stocks with similar financial metrics, market capitalization, and price volatility to NAVIENT CORP are BLX, CIM, BBDC, WHF, and LFT.
- NAVI's SEC filings can be seen here. And to visit NAVIENT CORP's official web site, go to www.navient.com.
NAVI Valuation Summary
- NAVI's EV/EBIT ratio is 97.5; this is 802.78% higher than that of the median Financial Services stock.
- Over the past 111 months, NAVI's EV/EBIT ratio has gone up 29.7.
Below are key valuation metrics over time for NAVI.
Stock | Date | P/S | P/B | P/E | EV/EBIT |
---|---|---|---|---|---|
NAVI | 2023-05-19 | 1.3 | 0.7 | 3.9 | 97.5 |
NAVI | 2023-05-18 | 1.4 | 0.7 | 3.9 | 97.5 |
NAVI | 2023-05-17 | 1.3 | 0.7 | 3.9 | 97.5 |
NAVI | 2023-05-16 | 1.3 | 0.6 | 3.8 | 97.4 |
NAVI | 2023-05-15 | 1.3 | 0.6 | 3.8 | 97.5 |
NAVI | 2023-05-12 | 1.3 | 0.6 | 3.8 | 97.4 |
NAVI Growth Metrics
- Its 2 year price growth rate is now at 133.17%.
- The year over year cash and equivalents growth rate now stands at -21.65%.
- The 4 year price growth rate now stands at -54.79%.

The table below shows NAVI's growth in key financial areas (numbers in millions of US dollars).
Date | Revenue | Operating Cash Flow | Net Income to Common Stock |
---|---|---|---|
2022-09-30 | 1,817 | 266 | 529 |
2022-06-30 | 1,927 | 399 | 597 |
2022-03-31 | 1,989 | 414 | 602 |
2021-12-31 | 2,199 | 702 | 717 |
2021-09-30 | 2,234 | 705 | 913 |
2021-06-30 | 2,261 | 725 | 947 |
NAVI's Quality Factors
The “Quality” component of the POWR Ratings focuses on 31 different factors of a companies fundamentals and operational strength. Here are some key insights as we drill into the specifics of these quality attributes.- NAVI has a Quality Grade of C, ranking ahead of 74.08% of graded US stocks.
- NAVI's asset turnover comes in at 0.026 -- ranking 323rd of 443 Trading stocks.
- GROW, AIV, and GS are the stocks whose asset turnover ratios are most correlated with NAVI.
The table below shows NAVI's key quality metrics over time.
Period | Asset Turnover | Gross Margin | ROIC |
---|---|---|---|
2021-09-30 | 0.026 | 1 | 0.007 |
2021-06-30 | 0.026 | 1 | 0.007 |
2021-03-31 | 0.024 | 1 | 0.007 |
2020-12-31 | 0.017 | 1 | 0.003 |
2020-09-30 | 0.016 | 1 | 0.003 |
2020-06-30 | 0.015 | 1 | 0.002 |
NAVI Price Target
For more insight on analysts targets of NAVI, see our NAVI price target page. And for a list of of all stocks sorted by upside potential based on analyst target price, see our Top Price Target page.
Average Price Target | $21.35 | Average Broker Recommendation | 1.59 (Moderate Buy) |
Navient Corporation (NAVI) Company Bio
Navient Corporation provides financial products and services in the United States. The company operates in four segments: FFELP Loans, Private Education Loans, Business Services, and Other. The company was founded in 2014 and is based in Wilmington, Delaware.
Latest NAVI News From Around the Web
Below are the latest news stories about NAVIENT CORP that investors may wish to consider to help them evaluate NAVI as an investment opportunity.
Navient completes plans for orderly LIBOR transitionWILMINGTON, Del., June 05, 2023 (GLOBE NEWSWIRE) -- Navient (Nasdaq: NAVI), a leader in technology-enabled education finance and business processing solutions, announced that it plans to transition outstanding U.S. Dollar (USD) LIBOR-indexed Navient-issued instruments to Secured Overnight Financing Rate (SOFR) after June 30, 2023. USD LIBOR will stop being published after June 30, 2023 and will be replaced by SOFR in many financial contracts. Navient and certain of its affiliates/subsidiaries ha |
Palo Alto Networks Set to S&P 500; Others to Join S&P MidCap 400 and S&P SmallCap 600S&P Dow Jones Indices ("S&P DJI") will make the following changes to the S&P 500, S&P MidCap 400, and S&P SmallCap 600 indices effective prior to the open of trading on Tuesday, June 20, to coincide with the quarterly rebalance. The U.S. equity markets will be closed on Monday, June 19 in observance of the Juneteenth holiday. The changes ensure each index is more representative of its market capitalization range. All companies moving to the S&P MidCap 400 are more representative of the mid-cap m |
Navient and Other Stocks Rise on Prospect of Restarting Federal Student Loan PaymentsThe measure to raise the nation's debt ceiling includes a provision to restart federal student loan repayments that have been paused since March 2020. |
Credit Acceptance (CACC) Up 6.7% Since Last Earnings Report: Can It Continue?Credit Acceptance (CACC) reported earnings 30 days ago. What's next for the stock? We take a look at earnings estimates for some clues. |
Navient (NASDAQ:NAVI) Is Due To Pay A Dividend Of $0.16The board of Navient Corporation ( NASDAQ:NAVI ) has announced that it will pay a dividend on the 16th of June, with... |
NAVI Price Returns
1-mo | 24.49% |
3-mo | 11.19% |
6-mo | 10.78% |
1-year | 35.39% |
3-year | 159.30% |
5-year | 58.91% |
YTD | 13.01% |
2022 | -19.35% |
2021 | 124.11% |
2020 | -23.13% |
2019 | 63.11% |
2018 | -30.45% |
NAVI Dividends
Ex-Dividend Date | Type | Payout Amount | Change | ||||||
---|---|---|---|---|---|---|---|---|---|
Loading, please wait... |
Continue Researching NAVI
Want to do more research on Navient Corp's stock and its price? Try the links below:Navient Corp (NAVI) Stock Price | Nasdaq
Navient Corp (NAVI) Stock Quote, History and News - Yahoo Finance
Navient Corp (NAVI) Stock Price and Basic Information | MarketWatch
Loading social stream, please wait...