
National Bank Holdings Corporation (NBHC): Price and Financial Metrics
NBHC Price/Volume Stats
| Current price | $43.33 | 52-week high | $46.51 |
| Prev. close | $42.99 | 52-week low | $28.38 |
| Day low | $42.98 | Volume | 349,906 |
| Day high | $43.80 | Avg. volume | 201,433 |
| 50-day MA | $38.70 | Dividend yield | 2.46% |
| 200-day MA | $35.23 | Market Cap | 1.64B |
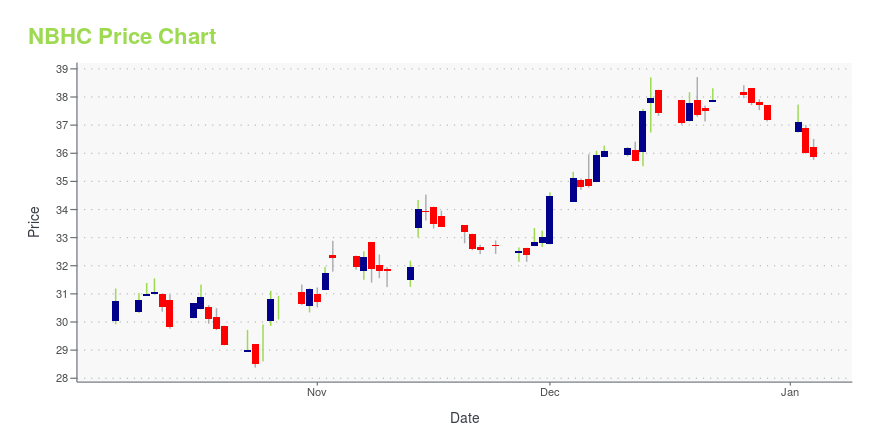
NBHC Stock Price Chart Interactive Chart >
National Bank Holdings Corporation (NBHC) Company Bio
National Bank Holdings operates as the bank holding company for NBH Bank, N.A. that provides various banking products and financial services to commercial and consumer clients in Colorado, greater Kansas City region, and Texas. The company was founded in 2009 and is based in Greenwood Village, Colorado.
Latest NBHC News From Around the Web
Below are the latest news stories about NATIONAL BANK HOLDINGS CORP that investors may wish to consider to help them evaluate NBHC as an investment opportunity.
Is It Smart To Buy National Bank Holdings Corporation (NYSE:NBHC) Before It Goes Ex-Dividend?Regular readers will know that we love our dividends at Simply Wall St, which is why it's exciting to see National Bank... |
Insider Sell Alert: EVP Christopher Randall Sells 4,000 Shares of National Bank Holdings Corp (NBHC)Recent filings with the SEC have revealed that Christopher Randall, EVP, COMM. & SPECIALTY BANKING at National Bank Holdings Corp (NYSE:NBHC), has sold 4,000 shares of the company's stock on November 15, 2023. |
National Bank Holdings' (NYSE:NBHC) Shareholders Will Receive A Bigger Dividend Than Last YearThe board of National Bank Holdings Corporation ( NYSE:NBHC ) has announced that it will be paying its dividend of... |
National Bank Holdings Corporation Announces 3.8% Increase to Quarterly DividendDENVER, Nov. 07, 2023 (GLOBE NEWSWIRE) -- National Bank Holdings Corporation (NYSE: NBHC) announced today that its Board of Directors approved a cash dividend to shareholders. The quarterly cash dividend will increase 3.8% from twenty-six cents ($0.26) to twenty-seven cents ($0.27) per share of common stock. The dividend will be payable on December 15, 2023 to shareholders of record at the close of business on November 24, 2023. “We are very pleased to be delivering a 3.8% increase in our divide |
National Bank Holdings Corporation (NYSE:NBHC) Q3 2023 Earnings Call TranscriptNational Bank Holdings Corporation (NYSE:NBHC) Q3 2023 Earnings Call Transcript October 25, 2023 Operator: Good morning, everyone, and welcome to the National Bank Holdings Corporation 2023 Third Quarter Earnings Call. My name is Marjorie, and I’ll be your conference operator for today. At this time, all participants are in a listen-only mode. We will conduct […] |
NBHC Price Returns
| 1-mo | 16.86% |
| 3-mo | 30.35% |
| 6-mo | 22.32% |
| 1-year | 31.41% |
| 3-year | 32.50% |
| 5-year | 32.95% |
| YTD | 18.37% |
| 2023 | -8.81% |
| 2022 | -2.16% |
| 2021 | 37.06% |
| 2020 | -4.50% |
| 2019 | 16.56% |
NBHC Dividends
| Ex-Dividend Date | Type | Payout Amount | Change | ||||||
|---|---|---|---|---|---|---|---|---|---|
| Loading, please wait... | |||||||||
Continue Researching NBHC
Want to see what other sources are saying about National Bank Holdings Corp's financials and stock price? Try the links below:National Bank Holdings Corp (NBHC) Stock Price | Nasdaq
National Bank Holdings Corp (NBHC) Stock Quote, History and News - Yahoo Finance
National Bank Holdings Corp (NBHC) Stock Price and Basic Information | MarketWatch
Loading social stream, please wait...