Nabors Industries Ltd. (NBR): Price and Financial Metrics
GET POWR RATINGS... FREE!
NBR POWR Grades
- Momentum is the dimension where NBR ranks best; there it ranks ahead of 99.98% of US stocks.
- The strongest trend for NBR is in Growth, which has been heading up over the past 177 days.
- NBR's current lowest rank is in the Stability metric (where it is better than 19.87% of US stocks).
NBR Stock Summary
- NABORS INDUSTRIES LTD's capital turnover -- a measure of revenue relative to shareholder's equity -- is better than 92.23% of US listed stocks.
- Equity multiplier, or assets relative to shareholders' equity, comes in at 9.84 for NABORS INDUSTRIES LTD; that's greater than it is for 90.69% of US stocks.
- Shareholder yield, a measure of how much is returned to shareholders via dividends and share repurchases, for NBR comes in at 24.9% -- higher than that of 94.26% of stocks in our set.
- If you're looking for stocks that are quantitatively similar to NABORS INDUSTRIES LTD, a group of peers worth examining would be GOCO, CENX, SM, USX, and HNRG.
- Visit NBR's SEC page to see the company's official filings. To visit the company's web site, go to www.nabors.com.
NBR Valuation Summary
- NBR's price/sales ratio is 0.7; this is 61.11% lower than that of the median Energy stock.
- Over the past 243 months, NBR's price/earnings ratio has gone down 35.
Below are key valuation metrics over time for NBR.
Stock | Date | P/S | P/B | P/E | EV/EBIT |
---|---|---|---|---|---|
NBR | 2023-01-13 | 0.7 | 3.6 | -4.0 | -23.1 |
NBR | 2023-01-12 | 0.6 | 3.6 | -4.0 | -23.0 |
NBR | 2023-01-11 | 0.6 | 3.5 | -3.9 | -22.7 |
NBR | 2023-01-10 | 0.6 | 3.5 | -3.8 | -22.7 |
NBR | 2023-01-09 | 0.6 | 3.3 | -3.7 | -22.2 |
NBR | 2023-01-06 | 0.6 | 3.3 | -3.6 | -22.1 |
NBR Growth Metrics
- The 2 year price growth rate now stands at 943.84%.
- The 5 year net income to common stockholders growth rate now stands at -27.31%.
- The 4 year revenue growth rate now stands at 38.32%.

The table below shows NBR's growth in key financial areas (numbers in millions of US dollars).
Date | Revenue | Operating Cash Flow | Net Income to Common Stock |
---|---|---|---|
2022-09-30 | 2,443.111 | 403.393 | -394.873 |
2022-06-30 | 2,268.527 | 377.723 | -503.59 |
2022-03-31 | 2,126.033 | 390.64 | -616.682 |
2021-12-31 | 2,019.105 | 428.776 | -572.925 |
2021-09-30 | 1,922.148 | 428.338 | -571.138 |
2021-06-30 | 1,835.393 | 361.192 | -609.756 |
NBR's Quality Factors
The “Quality” component of the POWR Ratings focuses on 31 different factors of a companies fundamentals and operational strength. Here are some key insights as we drill into the specifics of these quality attributes.- NBR has a Quality Grade of C, ranking ahead of 66.24% of graded US stocks.
- NBR's asset turnover comes in at 0.34 -- ranking 81st of 137 Petroleum and Natural Gas stocks.
- PHX, EGY, and LPI are the stocks whose asset turnover ratios are most correlated with NBR.
The table below shows NBR's key quality metrics over time.
Period | Asset Turnover | Gross Margin | ROIC |
---|---|---|---|
2021-06-30 | 0.340 | 0.375 | -0.046 |
2021-03-31 | 0.334 | 0.383 | -0.039 |
2020-12-31 | 0.362 | 0.376 | -0.067 |
2020-09-30 | 0.387 | 0.378 | -0.083 |
2020-06-30 | 0.414 | 0.376 | -0.072 |
2020-03-31 | 0.425 | 0.368 | -0.074 |
NBR Price Target
For more insight on analysts targets of NBR, see our NBR price target page. And for a list of of all stocks sorted by upside potential based on analyst target price, see our Top Price Target page.
Average Price Target | $93.78 | Average Broker Recommendation | 2.18 (Hold) |
NBR Stock Price Chart Interactive Chart >
NBR Price/Volume Stats
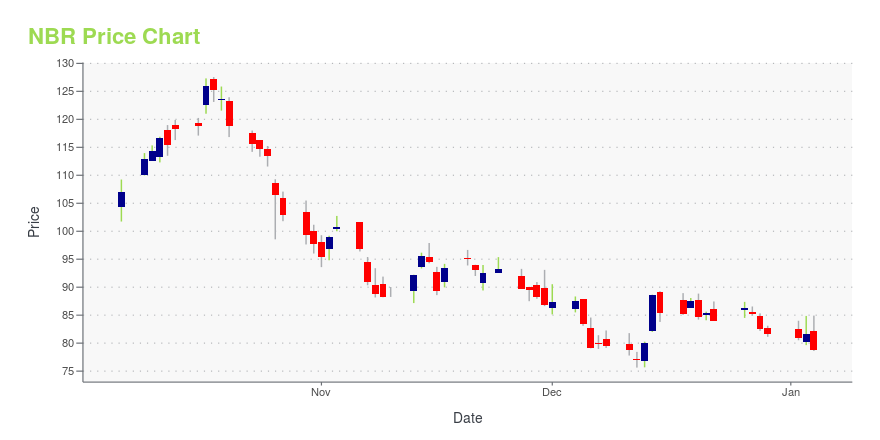
Current price | $174.85 | 52-week high | $207.67 |
Prev. close | $176.12 | 52-week low | $92.66 |
Day low | $174.74 | Volume | 88,600 |
Day high | $182.06 | Avg. volume | 141,956 |
50-day MA | $157.28 | Dividend yield | N/A |
200-day MA | $144.03 | Market Cap | 1.65B |
Nabors Industries Ltd. (NBR) Company Bio
Nabors Industries provides drilling and rig services. The company offers rig instrumentation, optimization software, and directional drilling services. It also provides completion, life-of-well maintenance, and plugging and abandonment of a well. The company was founded in 1968 and is based in Hamilton, Bermuda.
Latest NBR News From Around the Web
Below are the latest news stories about NABORS INDUSTRIES LTD that investors may wish to consider to help them evaluate NBR as an investment opportunity.
Nabors Industries Ltd. – Consensus Indicates Potential 16.0% UpsideNabors Industries Ltd. found using ticker (NBR) now have 9 analysts in total covering the stock. The consensus rating is ''Hold''. The target price ranges between 287 and 155 and has a mean target at 197.56. Now with the previous closing price of 170.27 this is indicating there is a potential upside of 16.0%. The 50 day MA is 156.86 and the 200 moving average now moves to 143.52. The market capitalisation for the company is $1,641m. Company Website: https://www.nabors.com [stock_market_widget type="chart" template="basic" color="green" assets="NBR" range="6mo" interval="1d" axes="true" cursor="true" api="yf"] The potential market cap would be $1,904m based on the market concensus. Nabors Industries Ltd. provides drilling and drilling-related services for land-based and offshore oil and ... |
ExxonMobil (XOM) Set to Begin Beaumont Oil Refinery ExpansionExxonMobil (XOM) plans to advance the refinery's new CDU slowly to cope with potential startup problems. |
Loss-Making Nabors Industries Ltd. (NYSE:NBR) Set To BreakevenWith the business potentially at an important milestone, we thought we'd take a closer look at Nabors Industries Ltd.'s... |
Nabors Industries Ltd. – Consensus Indicates Potential 18.9% UpsideNabors Industries Ltd. found using ticker (NBR) now have 9 analysts covering the stock with the consensus suggesting a rating of ''Hold''. The range between the high target price and low target price is between 287 and 155 calculating the mean target price we have 192.56. Given that the stocks previous close was at 161.98 this would imply there is a potential upside of 18.9%. The 50 day moving average now sits at 156.76 and the 200 moving average now moves to 143.28. The market cap for the company is $1,572m. Find out more information at: https://www.nabors.com [stock_market_widget type="chart" template="basic" color="green" assets="NBR" range="6mo" interval="1d" axes="true" cursor="true" api="yf"] The potential market cap would be $1,869m based on the market concensus. Nabors Industrie... |
3 Oil and Gas Stocks with Huge Prospects in 2023While many investors now believe inflation and elevated energy prices are in the rear-view mirror there are still catalysts that can cause energy prices to rally in 2023 |
NBR Price Returns
1-mo | 12.90% |
3-mo | 0.47% |
6-mo | 25.47% |
1-year | 62.80% |
3-year | 53.58% |
5-year | -51.82% |
YTD | 12.90% |
2022 | 90.99% |
2021 | 39.26% |
2020 | -58.62% |
2019 | 46.33% |
2018 | -69.27% |
Continue Researching NBR
Want to see what other sources are saying about Nabors Industries Ltd's financials and stock price? Try the links below:Nabors Industries Ltd (NBR) Stock Price | Nasdaq
Nabors Industries Ltd (NBR) Stock Quote, History and News - Yahoo Finance
Nabors Industries Ltd (NBR) Stock Price and Basic Information | MarketWatch
Loading social stream, please wait...