
NovaBay Pharmaceuticals, Inc. (NBY): Price and Financial Metrics
NBY Price/Volume Stats
| Current price | $0.58 | 52-week high | $9.08 |
| Prev. close | $0.60 | 52-week low | $0.36 |
| Day low | $0.58 | Volume | 69,800 |
| Day high | $0.60 | Avg. volume | 264,129 |
| 50-day MA | $0.65 | Dividend yield | N/A |
| 200-day MA | $1.09 | Market Cap | 2.83M |
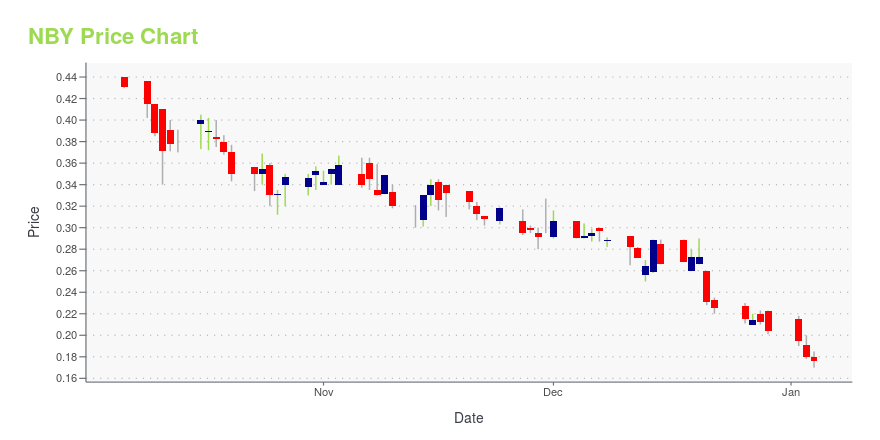
NBY Stock Price Chart Interactive Chart >
NovaBay Pharmaceuticals, Inc. (NBY) Company Bio
NovaBay Pharmaceuticals, Inc., a biopharmaceutical company, develops and commercializes non-antibiotic anti-infective products for the eye care market in the United States. The company was founded in 2000 and is based in Emeryville, California.
NBY Price Returns
| 1-mo | -10.77% |
| 3-mo | 8.43% |
| 6-mo | 22.91% |
| 1-year | -88.19% |
| 3-year | -99.83% |
| 5-year | -99.85% |
| YTD | -3.49% |
| 2024 | -91.58% |
| 2023 | -89.54% |
| 2022 | -85.21% |
| 2021 | -45.97% |
| 2020 | 8.91% |
Continue Researching NBY
Want to see what other sources are saying about NovaBay Pharmaceuticals Inc's financials and stock price? Try the links below:NovaBay Pharmaceuticals Inc (NBY) Stock Price | Nasdaq
NovaBay Pharmaceuticals Inc (NBY) Stock Quote, History and News - Yahoo Finance
NovaBay Pharmaceuticals Inc (NBY) Stock Price and Basic Information | MarketWatch
Loading social stream, please wait...