
NovaBay Pharmaceuticals, Inc. (NBY): Price and Financial Metrics
NBY Price/Volume Stats
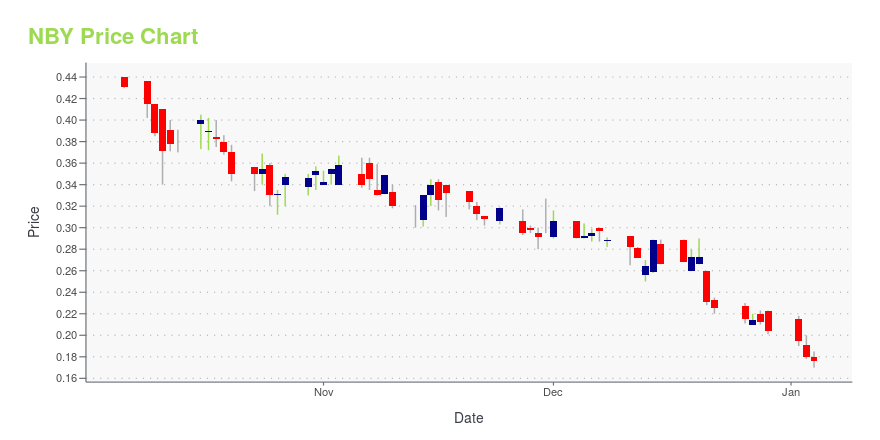
| Current price | $0.08 | 52-week high | $1.42 |
| Prev. close | $0.08 | 52-week low | $0.07 |
| Day low | $0.08 | Volume | 2,535,020 |
| Day high | $0.09 | Avg. volume | 3,351,157 |
| 50-day MA | $0.12 | Dividend yield | N/A |
| 200-day MA | $0.33 | Market Cap | 2.84M |
NBY Stock Price Chart Interactive Chart >
NovaBay Pharmaceuticals, Inc. (NBY) Company Bio
NovaBay Pharmaceuticals, Inc., a biopharmaceutical company, develops and commercializes non-antibiotic anti-infective products for the eye care market in the United States. The company was founded in 2000 and is based in Emeryville, California.
Latest NBY News From Around the Web
Below are the latest news stories about NOVABAY PHARMACEUTICALS INC that investors may wish to consider to help them evaluate NBY as an investment opportunity.
NovaBay Pharmaceuticals Partners with Woo University to Educate Eyecare Professionals on the Use of Amniotic MembranesEMERYVILLE, Calif., December 06, 2023--NovaBay Pharmaceuticals, Inc. (NYSE American: NBY) announces its partnership with Woo University to support the education of eyecare professionals on the use of amniotic membranes. A free webinar is being held Thursday, December 7, 2023 from 5:30-6:30 pm Pacific time, and eyecare professionals can register here. In September 2023 NovaBay commercially launched its prescription amniotic membrane product Avenova® Allograft, which is intended for use as a prote |
NovaBay Pharmaceuticals, Inc. (AMEX:NBY) Q3 2023 Earnings Call TranscriptNovaBay Pharmaceuticals, Inc. (AMEX:NBY) Q3 2023 Earnings Call Transcript November 9, 2023 Operator: Welcome to the NovaBay Pharmaceuticals Third Quarter 2023 Financial Results Conference Call. [Operator Instructions] As a reminder, this conference is being recorded. I would now like to turn the conference over to Ms. Jody Cain. Please go ahead, ma’am. Jody Cain: This […] |
NovaBay Pharmaceuticals Reports Third Quarter 2023 Financial ResultsEMERYVILLE, Calif., November 09, 2023--NovaBay® Pharmaceuticals, Inc. (NYSE American: NBY) reports financial results for the three and nine months ended September 30, 2023 and provides a business update. |
NovaBay Pharmaceuticals to Hold Third Quarter 2023 Conference Call on November 9, 2023EMERYVILLE, Calif., November 02, 2023--NovaBay® Pharmaceuticals, Inc. (NYSE American: NBY) announces that it will report financial results for the three and nine months ended September 30, 2023 after market close on Thursday, November 9, 2023 and will hold an investment community conference call that day beginning at 4:30 p.m. Eastern time. |
NovaBay Pharmaceuticals Expands Physician Dispensed Sales Channel with New Avenova ProgramsEMERYVILLE, Calif., October 11, 2023--NovaBay® Pharmaceuticals, Inc. (NYSE American: NBY), a company developing and commercializing high-quality eyecare, skincare and wound care products, announces the launch of two new promotional programs for ophthalmologists and optometrists who help their patients manage the symptoms of chronic dry eye with Avenova®-branded products. Through the new Avenova Loyalty Program and Avenova Affiliate Program, top Avenova eyecare professionals will have access to s |
NBY Price Returns
| 1-mo | -28.06% |
| 3-mo | -51.22% |
| 6-mo | -76.94% |
| 1-year | -94.20% |
| 3-year | -99.71% |
| 5-year | -99.77% |
| YTD | -60.78% |
| 2023 | -89.54% |
| 2022 | -85.21% |
| 2021 | -45.97% |
| 2020 | 8.91% |
| 2019 | -16.88% |
Continue Researching NBY
Want to see what other sources are saying about NovaBay Pharmaceuticals Inc's financials and stock price? Try the links below:NovaBay Pharmaceuticals Inc (NBY) Stock Price | Nasdaq
NovaBay Pharmaceuticals Inc (NBY) Stock Quote, History and News - Yahoo Finance
NovaBay Pharmaceuticals Inc (NBY) Stock Price and Basic Information | MarketWatch
Loading social stream, please wait...