
National CineMedia, Inc. (NCMI): Price and Financial Metrics
NCMI Price/Volume Stats
| Current price | $4.85 | 52-week high | $7.60 |
| Prev. close | $4.98 | 52-week low | $4.12 |
| Day low | $4.82 | Volume | 485,800 |
| Day high | $5.01 | Avg. volume | 677,855 |
| 50-day MA | $5.05 | Dividend yield | 2.39% |
| 200-day MA | $0.00 | Market Cap | 457.37M |
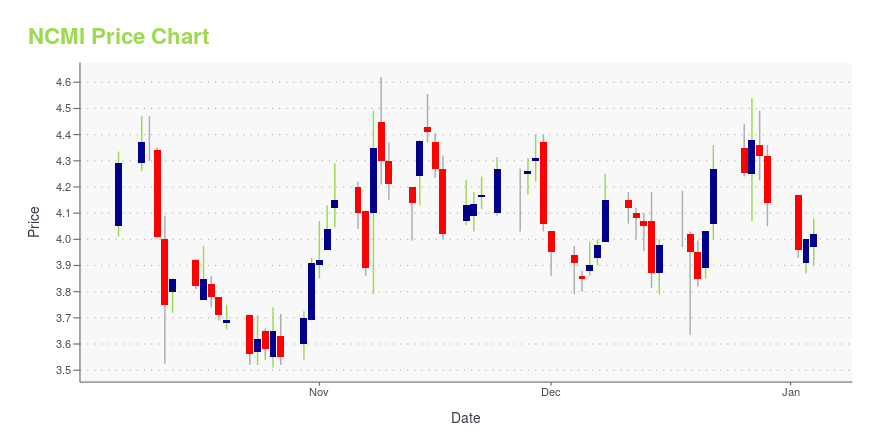
NCMI Stock Price Chart Interactive Chart >
NCMI Price Returns
| 1-mo | 0.10% |
| 3-mo | -13.65% |
| 6-mo | -25.58% |
| 1-year | -18.39% |
| 3-year | -65.80% |
| 5-year | -76.69% |
| YTD | -26.14% |
| 2024 | 60.39% |
| 2023 | 88.18% |
| 2022 | -91.68% |
| 2021 | -20.25% |
| 2020 | -43.83% |
NCMI Dividends
| Ex-Dividend Date | Type | Payout Amount | Change | ||||||
|---|---|---|---|---|---|---|---|---|---|
| Loading, please wait... | |||||||||
Continue Researching NCMI
Want to see what other sources are saying about National CineMedia Inc's financials and stock price? Try the links below:National CineMedia Inc (NCMI) Stock Price | Nasdaq
National CineMedia Inc (NCMI) Stock Quote, History and News - Yahoo Finance
National CineMedia Inc (NCMI) Stock Price and Basic Information | MarketWatch
Loading social stream, please wait...