
National CineMedia, Inc. (NCMI): Price and Financial Metrics
NCMI Price/Volume Stats
| Current price | $5.71 | 52-week high | $5.90 |
| Prev. close | $5.54 | 52-week low | $2.75 |
| Day low | $5.55 | Volume | 309,500 |
| Day high | $5.74 | Avg. volume | 678,294 |
| 50-day MA | $4.92 | Dividend yield | N/A |
| 200-day MA | $4.44 | Market Cap | 551.43M |
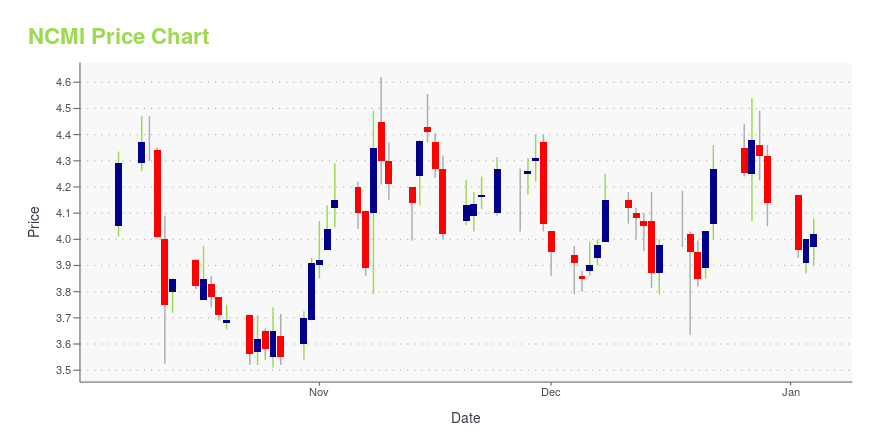
NCMI Stock Price Chart Interactive Chart >
Latest NCMI News From Around the Web
Below are the latest news stories about NATIONAL CINEMEDIA INC that investors may wish to consider to help them evaluate NCMI as an investment opportunity.
11 Cheapest Stocks With Biggest UpsideIn this piece, we will take a look at the 11 cheapest stocks with the biggest upside. If you want to skip our introduction to stock valuation and recent market news, then take a look at 5 Cheapest Stocks With Biggest Upside. Identifying the right stocks to invest in is a science that involves evaluating […] |
Are Business Services Stocks Lagging National CineMedia (NCMI) This Year?Here is how National CineMedia (NCMI) and OppFi Inc. (OPFI) have performed compared to their sector so far this year. |
National CineMedia, Inc. (NASDAQ:NCMI) Q3 2023 Earnings Call TranscriptNational CineMedia, Inc. (NASDAQ:NCMI) Q3 2023 Earnings Call Transcript November 7, 2023 National CineMedia, Inc. misses on earnings expectations. Reported EPS is $-0.34 EPS, expectations were $-0.14. Operator: Good day, and welcome to the National CineMedia, Inc. Q3 2023 Earnings Conference Call. Today all participants will be in a listen-only mode. [Operator Instructions] After today’s […] |
Zacks Industry Outlook Highlights Omnicom Group, National CineMedia and Harte HanksOmnicom Group, National CineMedia and Harte Hanks are part of the Zacks Industry Outlook article. |
National CineMedia (NCMI) Reports Q3 Earnings: What Key Metrics Have to SayWhile the top- and bottom-line numbers for National CineMedia (NCMI) give a sense of how the business performed in the quarter ended September 2023, it could be worth looking at how some of its key metrics compare to Wall Street estimates and year-ago values. |
NCMI Price Returns
| 1-mo | 30.07% |
| 3-mo | 27.88% |
| 6-mo | 34.99% |
| 1-year | 65.51% |
| 3-year | -82.12% |
| 5-year | -89.61% |
| YTD | 37.92% |
| 2023 | 88.18% |
| 2022 | -91.68% |
| 2021 | -20.25% |
| 2020 | -43.83% |
| 2019 | 23.32% |
Continue Researching NCMI
Want to see what other sources are saying about National CineMedia Inc's financials and stock price? Try the links below:National CineMedia Inc (NCMI) Stock Price | Nasdaq
National CineMedia Inc (NCMI) Stock Quote, History and News - Yahoo Finance
National CineMedia Inc (NCMI) Stock Price and Basic Information | MarketWatch
Loading social stream, please wait...