
nCino Inc. (NCNO): Price and Financial Metrics
NCNO Price/Volume Stats
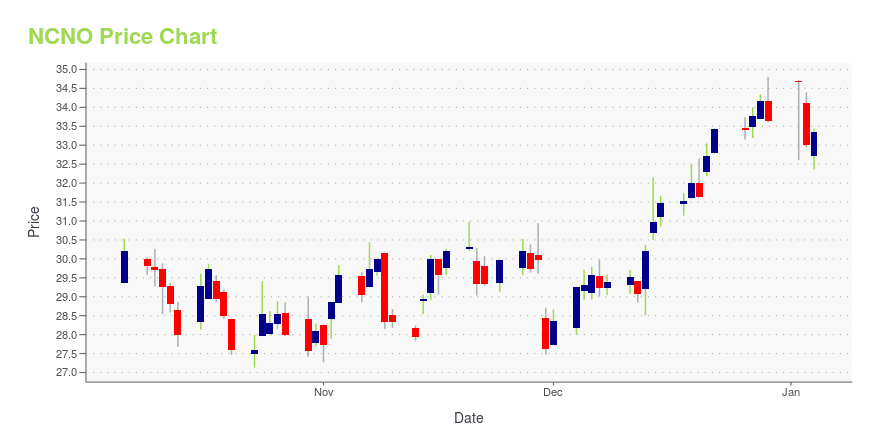
| Current price | $33.54 | 52-week high | $37.48 |
| Prev. close | $32.32 | 52-week low | $27.13 |
| Day low | $32.67 | Volume | 2,726,000 |
| Day high | $34.01 | Avg. volume | 1,004,659 |
| 50-day MA | $31.39 | Dividend yield | N/A |
| 200-day MA | $30.96 | Market Cap | 3.86B |
NCNO Stock Price Chart Interactive Chart >
nCino Inc. (NCNO) Company Bio
nCino, Inc. engages in the development of a cloud-based operating system for banks. Its end-to-end platform combines customer relationship management (CRM), customer onboarding, account opening, loan origination, deposit accounts, workflow, credit analysis, enterprise content management and instant reporting capabilities. The company was founded by Pullen Daniel, Neil Lawrence Underwood and James S. Mahan III on December 13, 2011 and is headquartered in Wilmington, NC.
Latest NCNO News From Around the Web
Below are the latest news stories about NCINO INC that investors may wish to consider to help them evaluate NCNO as an investment opportunity.
nCino and Salesforce Expand Strategic Partnership to Further Modernize the Financial Services IndustryLeaders in cloud innovation reinforce alliance to provide best-in-class solutions to the financial services industry by extending successful partnership to 2031 Updated commercial terms expected to improve nCino’s subscription gross margins WILMINGTON, N.C., Dec. 21, 2023 (GLOBE NEWSWIRE) -- nCino, Inc. (NASDAQ: NCNO), a pioneer in cloud banking for the global financial services industry, today announced an expanded partnership with Salesforce to accelerate the delivery of best-in-class cloud so |
Analysts Expect Breakeven For nCino, Inc. (NASDAQ:NCNO) Before LongnCino, Inc. ( NASDAQ:NCNO ) is possibly approaching a major achievement in its business, so we would like to shine some... |
nCino, Inc. (NASDAQ:NCNO) Q3 2024 Earnings Call TranscriptnCino, Inc. (NASDAQ:NCNO) Q3 2024 Earnings Call Transcript November 29, 2023 nCino, Inc. beats earnings expectations. Reported EPS is $0.14, expectations were $0.11. Operator: Thank you for standing by, and welcome to nCino’s Third Quarter Fiscal Year 2024 Financial Results Conference Call. At this time, all participants are in a listen-only mode. After the speakers’ […] |
Why nCino (NCNO) Shares Are Falling TodayShares of maker of operating system for banks nCino (NASDAQ:NCNO) fell 6.7% in the morning session after the company reported third quarter results and provided revenue guidance for the next quarter that fell below Wall Street's expectations, though revenue narrowly exceeded expectations during the quarter. In addition, GAAP operating income and free cash flow missed. Management acknowledged various challenges, particularly with enterprise banks. They noted that some deals were delayed into the |
Q3 2024 nCino Inc Earnings CallQ3 2024 nCino Inc Earnings Call |
NCNO Price Returns
| 1-mo | 6.58% |
| 3-mo | 13.66% |
| 6-mo | 6.41% |
| 1-year | 8.54% |
| 3-year | -47.08% |
| 5-year | N/A |
| YTD | -0.27% |
| 2023 | 27.19% |
| 2022 | -51.80% |
| 2021 | -24.24% |
| 2020 | N/A |
| 2019 | N/A |
Loading social stream, please wait...