Noodles & Company (NDLS): Price and Financial Metrics
GET POWR RATINGS... FREE!
NDLS POWR Grades
- NDLS scores best on the Value dimension, with a Value rank ahead of 86.37% of US stocks.
- The strongest trend for NDLS is in Value, which has been heading up over the past 179 days.
- NDLS ranks lowest in Sentiment; there it ranks in the 7th percentile.
NDLS Stock Summary
- The capital turnover (annual revenue relative to shareholder's equity) for NDLS is 12.63 -- better than 97.71% of US stocks.
- NDLS's current price/earnings ratio is 73.95, which is higher than 90.32% of US stocks with positive earnings.
- Equity multiplier, or assets relative to shareholders' equity, comes in at 9.76 for NOODLES & Co; that's greater than it is for 91.07% of US stocks.
- If you're looking for stocks that are quantitatively similar to NOODLES & Co, a group of peers worth examining would be SYNL, TTEC, MOD, ACEL, and RGS.
- Visit NDLS's SEC page to see the company's official filings. To visit the company's web site, go to www.noodles.com.
NDLS Valuation Summary
- NDLS's EV/EBIT ratio is 379.9; this is 2174.85% higher than that of the median Consumer Cyclical stock.
- NDLS's price/sales ratio has moved down 2.2 over the prior 99 months.
- NDLS's price/earnings ratio has moved down 2623.9 over the prior 99 months.
Below are key valuation metrics over time for NDLS.
Stock | Date | P/S | P/B | P/E | EV/EBIT |
---|---|---|---|---|---|
NDLS | 2021-08-27 | 1.3 | 16.4 | -2420.4 | 379.9 |
NDLS | 2021-08-26 | 1.2 | 15.6 | -2310.4 | 367.9 |
NDLS | 2021-08-25 | 1.3 | 16.1 | -2378.7 | 375.4 |
NDLS | 2021-08-24 | 1.3 | 15.9 | -2354.2 | 372.7 |
NDLS | 2021-08-23 | 1.3 | 15.9 | -2344.6 | 371.6 |
NDLS | 2021-08-20 | 1.3 | 15.9 | -2346.2 | 371.8 |
NDLS Growth Metrics
- Its 3 year revenue growth rate is now at -1.36%.
- The 4 year net income to common stockholders growth rate now stands at 82.54%.
- Its year over year net cashflow from operations growth rate is now at -53.7%.

The table below shows NDLS's growth in key financial areas (numbers in millions of US dollars).
Date | Revenue | Operating Cash Flow | Net Income to Common Stock |
---|---|---|---|
2021-12-31 | 475.152 | 36.165 | 3.665 |
2021-09-30 | 467.52 | 30.706 | 4.584 |
2021-06-30 | 448.376 | 25.663 | -0.24 |
2021-03-31 | 402.884 | 13.561 | -19.401 |
2020-12-31 | 393.655 | 9.124 | -23.259 |
2020-09-30 | 400.358 | 22.105 | -20.623 |
NDLS's Quality Factors
The “Quality” component of the POWR Ratings focuses on 31 different factors of a companies fundamentals and operational strength. Here are some key insights as we drill into the specifics of these quality attributes.- NDLS has a Quality Grade of C, ranking ahead of 68.5% of graded US stocks.
- NDLS's asset turnover comes in at 1.263 -- ranking 4th of 79 Restaraunts Hotels Motels stocks.
- PBPB, TAST, and LOCO are the stocks whose asset turnover ratios are most correlated with NDLS.
The table below shows NDLS's key quality metrics over time.
Period | Asset Turnover | Gross Margin | ROIC |
---|---|---|---|
2021-06-29 | 1.263 | 0.272 | 0.004 |
2021-03-30 | 1.087 | 0.254 | -0.029 |
2020-12-29 | 1.014 | 0.250 | -0.033 |
2020-09-29 | 1.015 | 0.259 | -0.028 |
2020-06-30 | 1.036 | 0.262 | -0.021 |
2020-03-31 | 1.167 | 0.276 | 0.002 |
NDLS Price Target
For more insight on analysts targets of NDLS, see our NDLS price target page. And for a list of of all stocks sorted by upside potential based on analyst target price, see our Top Price Target page.
Average Price Target | $9.10 | Average Broker Recommendation | 1.5 (Moderate Buy) |
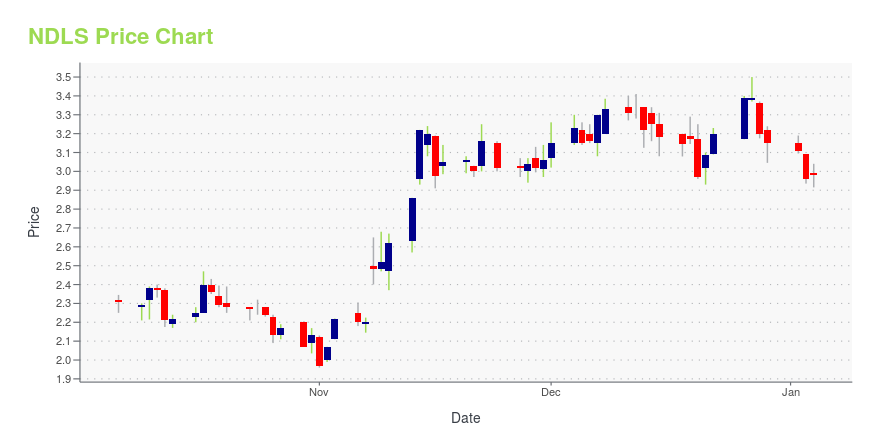
NDLS Stock Price Chart Interactive Chart >
NDLS Price/Volume Stats
Current price | $5.63 | 52-week high | $13.55 |
Prev. close | $5.05 | 52-week low | $4.62 |
Day low | $4.99 | Volume | 181,500 |
Day high | $5.70 | Avg. volume | 310,896 |
50-day MA | $5.64 | Dividend yield | N/A |
200-day MA | $9.27 | Market Cap | 258.05M |
Noodles & Company (NDLS) Company Bio
Noodles & Company develops and operates fast casual restaurants in the United States, offering cooked-to-order dishes, including noodles and pasta, soups, salads, sandwiches, and appetizers. The company was founded in 1995 and is based in Broomfield, Colorado.
Latest NDLS News From Around the Web
Below are the latest news stories about NOODLES & Co that investors may wish to consider to help them evaluate NDLS as an investment opportunity.
Noodles & Co. expects major expansion in 2022 amid growing online salesThe Broomfield-based chain used its revamped loyalty rewards program to bring in new members and drive repeat business in 2021. |
Noodles & Co. (NDLS) Reports Q4 Loss, Lags Revenue EstimatesNoodles & Co. (NDLS) delivered earnings and revenue surprises of -162.50% and 5%, respectively, for the quarter ended December 2021. Do the numbers hold clues to what lies ahead for the stock? |
Noodles & Co. stock falls 20% after restaurant chain swings to surprise quarterly lossShares of Noodles & Co. fell more than 20% in the extended session Wednesday after the restaurant chain reported a surprise quarterly loss and revenues that missed expectations, saying it faced staffing shortages and other challenges related to a COVID-19 surge late last year. Noodles & Co. said it lost $4.7 million, or 10 cents a share, in the fourth quarter, compared with a loss of $3.8 million, or 9 cents a share, in the year-ago quarter. Adjusted for one-time items, the company lost 5 cents |
Noodles & Company Announces Fourth Quarter and Full Year 2021 Financial ResultsFull Year 2021 Average Unit Volume Growth of 11.3% vs. 2019 Reiterates Unit Growth Target of 8% in 2022 and 10% Annually Thereafter BROOMFIELD, Colo., Feb. 23, 2022 (GLOBE NEWSWIRE) -- Noodles & Company (Nasdaq: NDLS) today announced financial results for the fourth quarter and fiscal year ended December 28, 2021, and provided an updated business outlook and accelerated growth objectives. Key highlights for fiscal year 2021 compared to fiscal year 2020 include: Total revenue increased 20.7% to $ |
Shake Shack (SHAK) Reports Q4 Loss, Tops Revenue EstimatesShake Shack (SHAK) delivered earnings and revenue surprises of 35.29% and 0.10%, respectively, for the quarter ended December 2021. Do the numbers hold clues to what lies ahead for the stock? |
NDLS Price Returns
1-mo | 18.28% |
3-mo | -20.70% |
6-mo | -47.19% |
1-year | -56.05% |
3-year | -27.82% |
5-year | 16.08% |
YTD | -37.93% |
2021 | 14.81% |
2020 | 42.60% |
2019 | -20.74% |
2018 | 33.14% |
2017 | 28.05% |
Continue Researching NDLS
Here are a few links from around the web to help you further your research on NOODLES & Co's stock as an investment opportunity:NOODLES & Co (NDLS) Stock Price | Nasdaq
NOODLES & Co (NDLS) Stock Quote, History and News - Yahoo Finance
NOODLES & Co (NDLS) Stock Price and Basic Information | MarketWatch
Loading social stream, please wait...